☀️ The SAD Lamp Database
Find your favorite SAD lamp with our handy database! The desktop experience is recommended.
Here is what we tested for and why!
Almost all lights have an “invisible flicker”, if this bothers you, our database has lots of info to help you choose flicker-free lamps.
*Flicker data is taken using the most effective color temperature and highest brightness setting, flicker almost always gets worse if the light is dimmed at all*
Show Your Support 😄
Your support makes it possible for us to keep testing!
The SAD Lamp Database
Our work is reader-supported; if you buy through our links, we may earn an affiliate commission.
| Image | Brand | Model | Amazon | Website | Price | CCT | Lux | CLA | M-EDI | Glare (lux/in2) | Area (in2) | CRI | Spectrum | Flicker Risk | Waveform | Flicker Index | Flicker Depth | Color Temperatures | Brightness Levels | Cord Length | Power | Coupon Code | Reviews | Voltage | ||||
|---|---|---|---|---|---|---|---|---|---|---|---|---|---|---|---|---|---|---|---|---|---|---|---|---|---|---|---|---|
 | Olly | Day | 99 | Check Price → | $$ | 5900K | 430 | 635 | 460 | 88 | 4.9 | 79 |  | No Risk |  | 0.3773 | 94.6% | 1 | 2 | N/A | Dimmable | No | No | |||||
 | Circadian Optics | Lumine | 50 | Check Price → | $ | 5700K | 3,800 | 5,365 | 3,160 | 143 | 26.5 | 79.1 |  | No Risk | 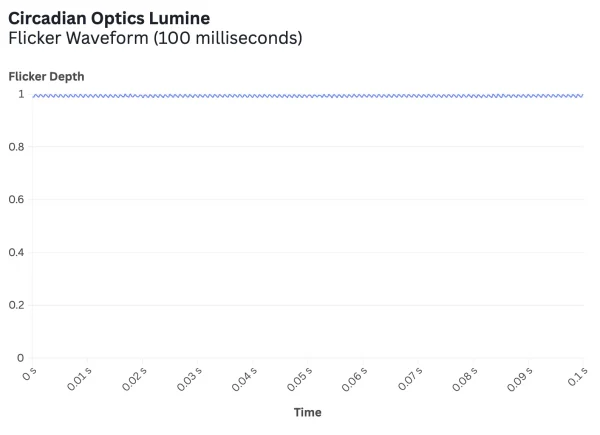 | 0.0001 | 2.6% | 1 | 3 | 7.3 ft | 17W | Dimmable | No | No | Review | 100-240V | ||
 | Circadian Optics | Luxy | 40 | Check Price → | Check Price → | $ | 6100K | 3,345 | 4,930 | 2,835 | 453 | 7.4 | 80.9 |  | No Risk | 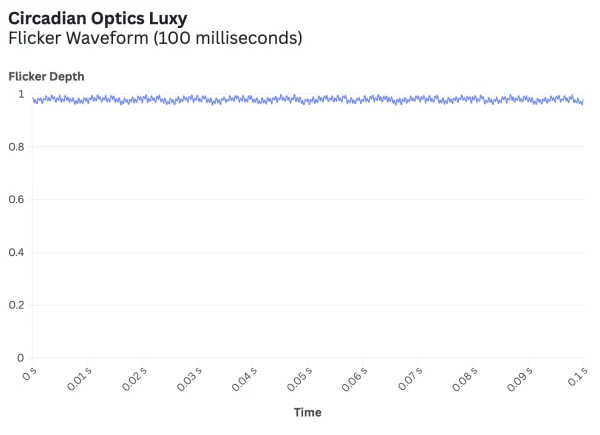 | 0.0033 | 2.1% | 1 | 3 | 5 ft | 5W | Dimmable | No | No | Review | 100-240V | |
 | Circadian Optics | Lattis | 80 | Check Price → | Check Price → | $ | 6150K | 4,955 | 7,910 | 4,475 | 246 | 20.1 | 82 |  | No Risk | 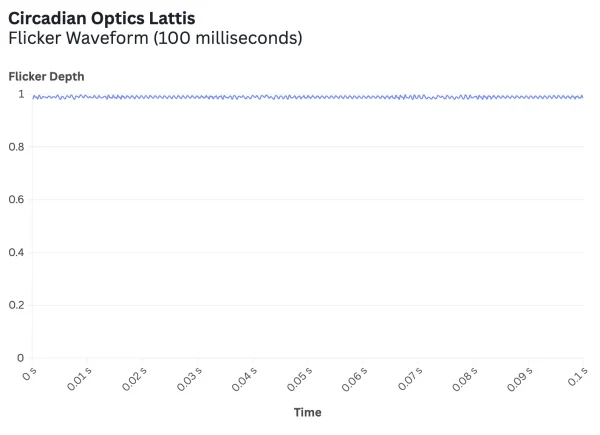 | 0.0012 | 1.1% | 1 | 3 | 7.3 ft | 20W | Dimmable | No | No | Review | 100-240V | |
 | Circadian Optics | Lumos 2.0 | 70 | Check Price → | Check Price → | $ | 6350K | 3,750 | 6,015 | 3,375 | 440 | 8.5 | 81.5 |  | No Risk | 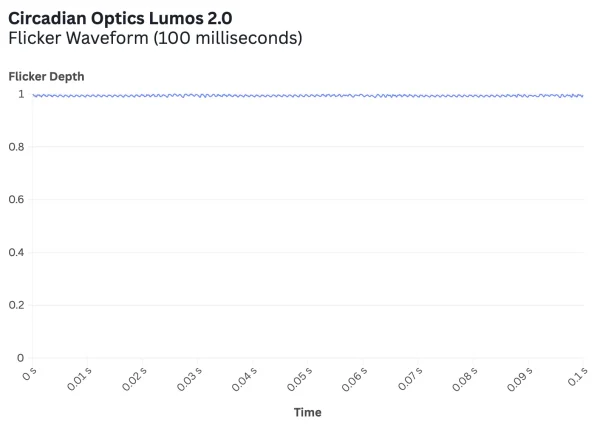 | 0.0028 | 2.2% | 1 | 3 | 7.3 ft | 12W | Dimmable | No | No | Review | 100-240V | |
 | Circadian Optics | Lampu | 80 | Check Price → | Check Price → | $ | 5750K | 9,685 | 15,530 | 8,160 | 235 | 41.3 | 78.9 |  | No Risk | 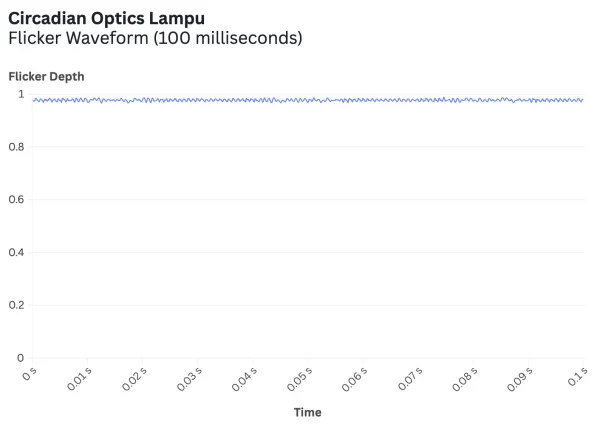 | 0.0032 | 1.6% | 1 | 3 | 7.3 ft | 29W | Dimmable | No | Yes | Review | 100-240V | |
 | Circadian Optics | Leo | 40 | Check Price → | $ | 6250K | 3,180 | 4,820 | 2,870 | 245 | 13 | 81.2 |  | No Risk | 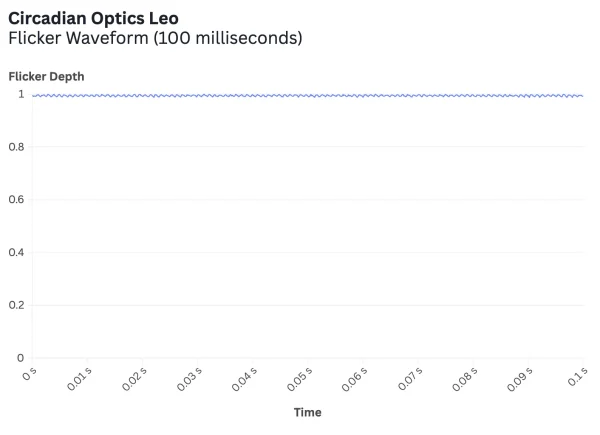 | 0.0003 | 0.8% | 1 | 3 | 7.3 ft | 15W | Dimmable | No | No | Review | 100-240V | ||
 | Verilux | HappyLight Compact | 30 | Check Price → | $ | 6850K | 1,925 | 2,560 | 1,620 | 91 | 21.2 | 69.1 |  | Low Risk |  | 0.0164 | 6.3% | 1 | 1 | 5 ft | Smart Outlet/Timer Compatible | No | No | Review | 100-240V | |||
 | Verilux | HappyLight Alba | 50 | Check Price → | $ | 5250K | 3,265 | 4,490 | 2,745 | 105 | 31.2 | 85.2 |  | No Risk | 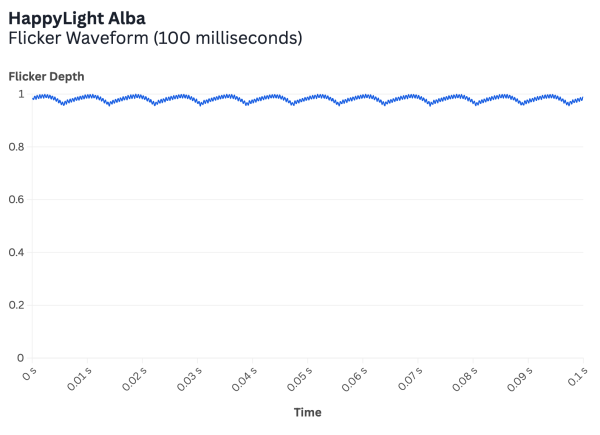 | 0.0042 | 2.2% | 3 | 4 | 5.8 ft | 20W | Dimmable, Adjustable Color Temperature | No | No | Review | 100-240V | ||
 | Verilux | HappyLight Full-Size | 49 | Check Price → | $ | 6300K | 4,675 | 6,745 | 3,875 | 113 | 41.5 | 76.8 |  | Low Risk | 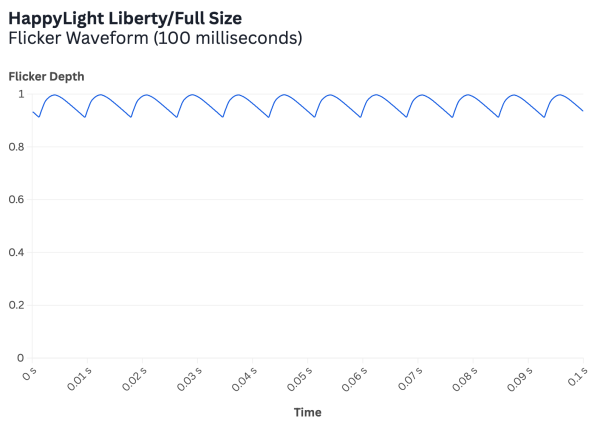 | 0.012 | 4.5% | 2 | 2 | 6.3 ft | 30W | Dimmable, Adjustable Color Temperature, Smart Outlet/Timer Compatible | No | No | Review | 120V | ||
 | Verilux | HappyLight Lumi Plus | 40 | Check Price → | $ | 5500K | 3,945 | 5,550 | 3,285 | 127 | 31 | 82.1 |  | No Risk |  | 0.3428 | 99% | 1 | 3 | 5.9 ft | Dimmable | No | No | Review | 100-240V | |||
 | Verilux | HappyLight Lucent | 40 | Check Price → | $ | 5250K | 4,150 | 5,470 | 3,235 | 114 | 36.3 | 76.3 |  | No Risk |  | 0.0081 | 3.7% | 1 | 1 | 5.9 ft | No | No | Review | 100-240V | ||||
 | Verilux | HappyLight Luxe | 70 | Check Price → | $ | 5400K | 4,155 | 5,800 | 3,430 | 79 | 52.9 | 83.8 |  | No Risk |  | 0.5628 | 99.5% | 3 | 4 | 5.9 ft | Dimmable, Adjustable Color Temperature | No | No | Review | 100-240V | |||
 | Verilux | HappyLight Touch Plus | 50 | Check Price → | $ | 5100K | 4,190 | 5,675 | 3,385 | 105 | 40 | 85.4 |  | No Risk |  | 0.1927 | 77.8% | 2 | 3 | 5.9 ft | Dimmable, Adjustable Color Temperature | No | No | Review | 100-240V | |||
 | Verilux | HappyLight Halo | 90 | Check Price → | $$ | 5150K | 4,635 | 6,130 | 3,595 | 102 | 45.3 | 79.8 |  | No Risk | 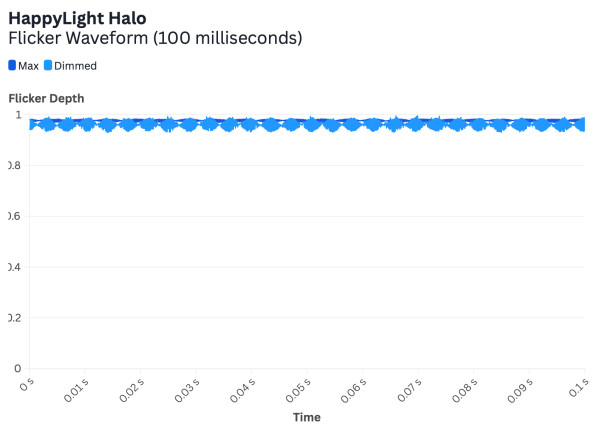 | 0.0038 | 2.7% | 3 | 4 | 5.9 ft | 19W | Dimmable, Adjustable Color Temperature, Battery Powered | No | No | Review | 100-240V | ||
 | Verilux | HappyLight Duo Desk | 80 | Check Price → | $$ | 5550K | 4,480 | 6,730 | 3,960 | 233 | 19.2 | 94.4 |  | No Risk | 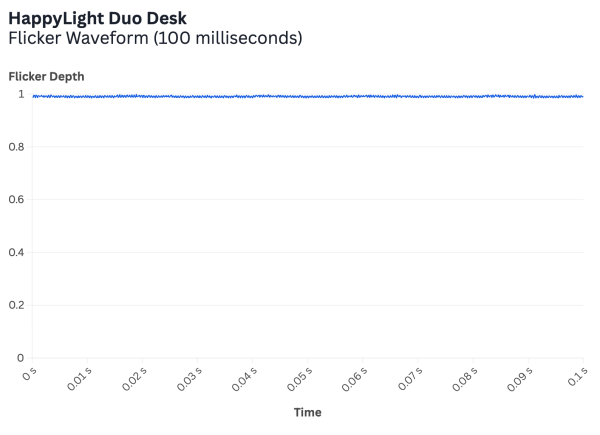 | 0.0007 | 0.6% | 3 | 7 | 5.9 ft | 16W | Dimmable, Adjustable Color Temperature | No | No | Review | 100-240V | ||
 | Verilux | HappyLight Duo Floor | 130 | Check Price → | $$ | 5000K | 11,260 | 18,715 | 9,850 | 431 | 26.1 | 88.8 |  | No Risk | 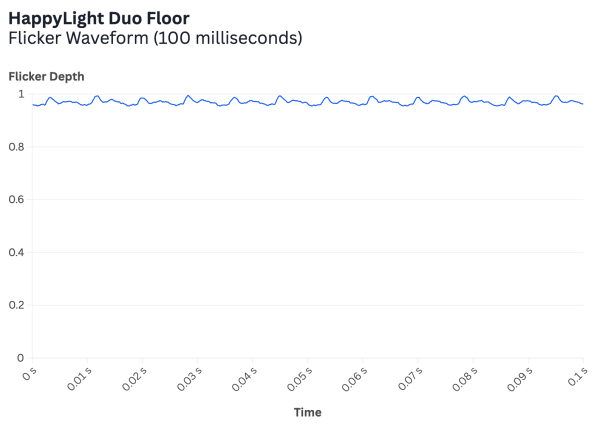 | 0.0033 | 2.1% | 3 | 5 | 6 ft | 34W | Dimmable, Adjustable Color Temperature | Yes | Yes | Review | 100-240V | ||
 | TheraLite | Aura | 43 | Check Price → | Check Price → | $ | 3000K | 11,780 | 11,650 | 6,255 | 144 | 82 | 80.7 |  | High Risk | 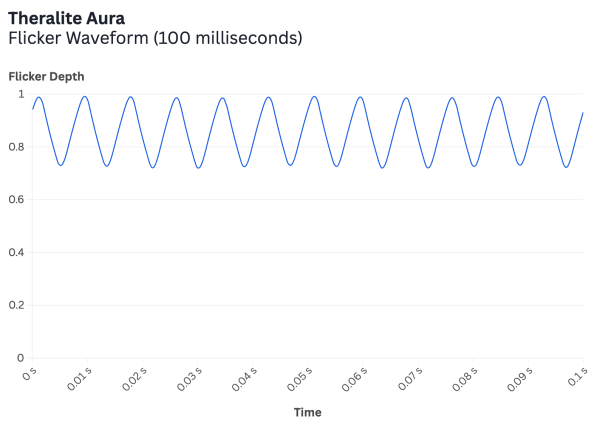 | 0.0381 | 12.4% | 1 | 4 | 5.4 ft | 35W | OPTIMIZE15 for 15% off | Dimmable | Yes | Yes | Review | 120V |
 | TheraLite | Aura Qi | 38 | Check Price → | Check Price → | $ | 3000K | 12,140 | 11,290 | 6,040 | 148 | 82 | 80.5 |  | No Risk | 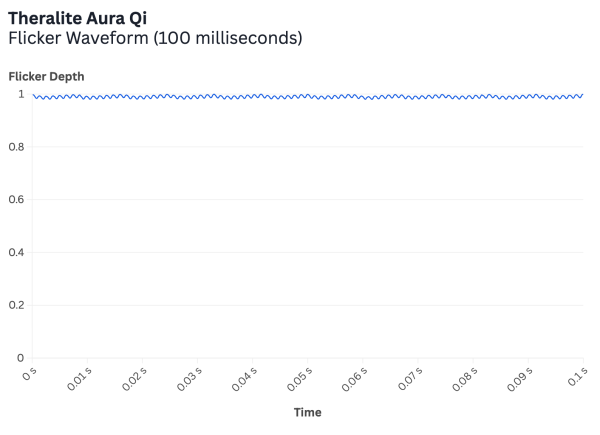 | 0.0015 | 1% | 1 | 4 | 5.3 ft | 36W | OPTIMIZE15 for 15% off | Dimmable | Yes | Yes | Review | 120V |
 | TheraLite | Halo | 50 | Check Price → | Check Price → | $ | 3000K | 5,020 | 4,480 | 2,545 | 157 | 32 | 80.7 |  | No Risk | 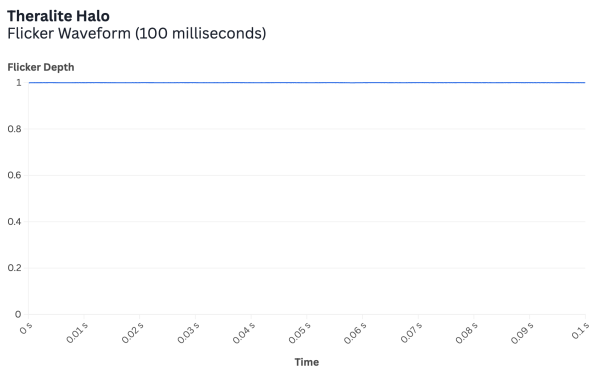 | 0 | 0.1% | 1 | 4 | 5.3 ft | 17W | OPTIMIZE15 for 15% off | Dimmable | No | No | Review | 120V |
 | TheraLite | Glow | 30 | Check Price → | Check Price → | $ | 4100K | 3,890 | 3,960 | 2,515 | 146 | 26.7 | 79.2 |  | High Risk | 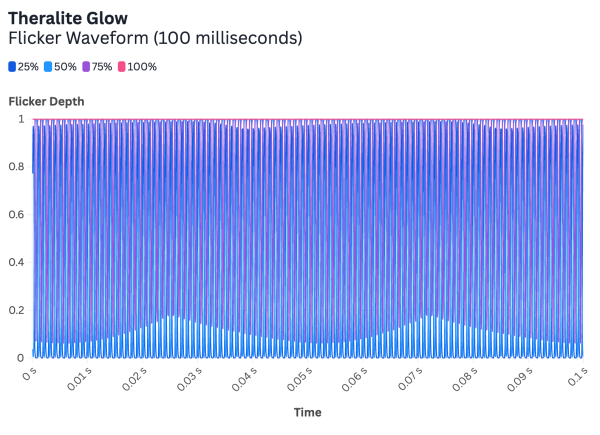 | 0.4197 | 98% | 1 | 4 | 5.9 ft | 11W | OPTIMIZE15 for 15% off | Dimmable | No | No | Review | 100-240V |
 | TheraLite | Radiance | 45 | Check Price → | Check Price → | $ | 2950K | 2,135 | 1,755 | 1,025 | 368 | 5.8 | 79.3 |  | High Risk | 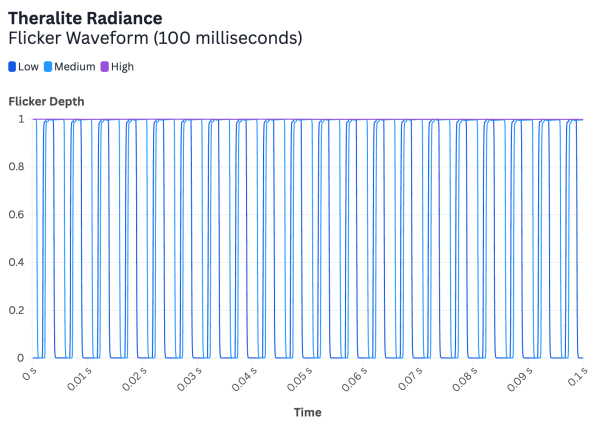 | 0.5486 | 100% | 1 | 3 | 5.9 ft | 8W | OPTIMIZE15 for 15% off | Dimmable | No | No | Review | 120V |
 | TheraLite | Original | 40 | Check Price → | Check Price → | $ | 3200K | 6,845 | 6,410 | 3,545 | 188 | 36.5 | 79.8 |  | No Risk | 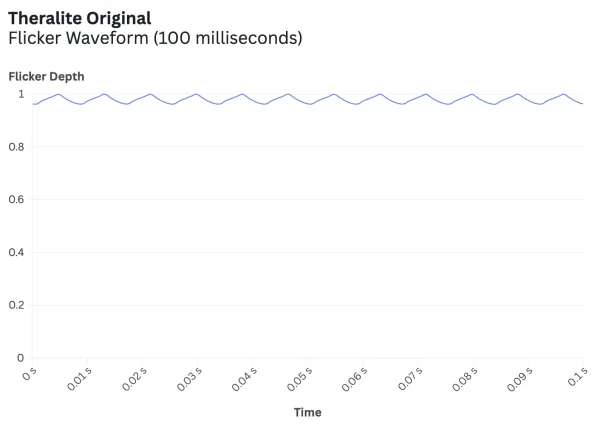 | 0.0053 | 1.9% | 1 | 1 | 4.9 ft | 19W | OPTIMIZE15 for 15% off | Smart Outlet/Timer Compatible | No | No | Review | 100-240V |
 | Lastar | CM011 | 28 | Check Price → | $ | 6250K | 1,715 | 2,555 | 1,650 | 62 | 27.6 | 95.7 |  | No Risk |  | 0.0041 | 1.1% | 1 | 3 | 6 ft | Dimmable | No | No | |||||
 | Lastar | CM003 | 35 | Check Price → | $ | 6200K | 3,150 | 4,335 | 2,660 | 88 | 35.7 | 73.5 |  | No Risk |  | 0.0477 | 26% | 1 | 5 | 6 ft | Dimmable | No | No | |||||
 | Lastar | CM019 | 50 | Check Price → | $ | 6950K | 2,065 | 3,150 | 1,880 | 60 | 34.6 |  | No Risk |  | 0.0059 | 2.3% | 4 | 5 | 6 ft | Dimmable, Adjustable Color Temperature | No | No | ||||||
 | Lastar | CM018B | 30 | Check Price → | $ | 6400K | 1,905 | 2,735 | 1,675 | 89 | 21.3 | 78.2 |  | No Risk |  | 0.0031 | 1% | 4 | 5 | 4.9 ft | Dimmable, Adjustable Color Temperature | No | No | |||||
 | Lastar | CM018 | 22 | Check Price → | $ | 6600K | 1,985 | 2,905 | 1,760 | 93 | 21.3 | 77.3 |  | No Risk |  | 0.0032 | 1% | 1 | 5 | 4.9 ft | Dimmable | No | No | |||||
 | Lastar | CM020 | 30 | Check Price → | $ | 6600K | 2,930 | 4,295 | 2,585 | 100 | 29.3 | 76.1 |  | No Risk |  | 0.0049 | 1.5% | 1 | 5 | 4.8 ft | Dimmable | No | No | |||||
 | Lastar | CM022 | 140 | Check Price → | $$ | 5950K | 5,215 | 8,350 | 4,845 | 69 | 75.9 | 95.9 |  | No Risk |  | 0.0406 | 21% | 4 | 5 | 8.3 ft | Dimmable, Adjustable Color Temperature | No | No | |||||
 | Lastar | CM021 | 80 | Check Price → | $$ | 5950K | 3,235 | 4,855 | 3,015 | 43 | 75.9 | 96.4 |  | No Risk |  | 0.2011 | 99.5% | 4 | 5 | 4.8 ft | Dimmable, Adjustable Color Temperature | No | No | |||||
 | Carex | Day-Light Classic | 120-150 | Check Price → | Check Price → | $$ | 4050K | 12,490 | 14,310 | 7,900 | 110 | 114 | 78.7 |  | High Risk | 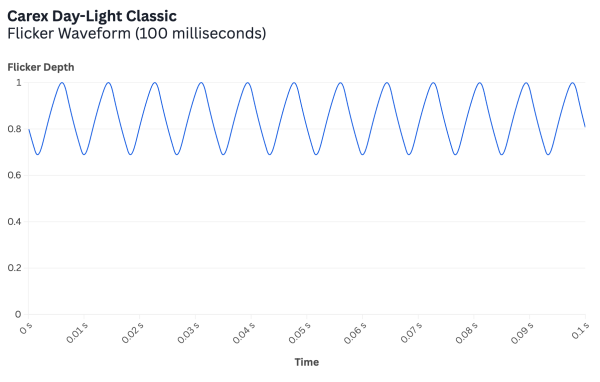 | 0.0538 | 18.3% | 1 | 2 | 6.3 ft | 37W | OPTIMIZE15 for 15% off | Dimmable, Smart Outlet/Timer Compatible | Yes | Yes | Review | 120V |
 | Carex | Day-Light Sky | 120-130 | Check Price → | Check Price → | $$ | 4200K | 14,540 | 17,760 | 9,485 | 181 | 80.5 | 78.3 |  | High Risk | 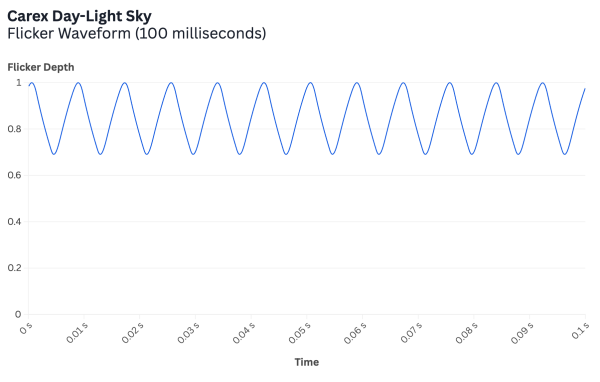 | 0.0531 | 18.2% | 1 | 2 | 6.3 ft | 40W | OPTIMIZE15 for 15% off | Dimmable, Smart Outlet/Timer Compatible | Yes | Yes | Review | 120V |
 | Alaska Northern Lights | Aurora LightPad Mini | 200 | Check Price → | Check Price → | $$$ | 6400K | 42,445 | 86,590 | 39,390 | 1,746 | 24.3 | 80.7 |  | No Risk | 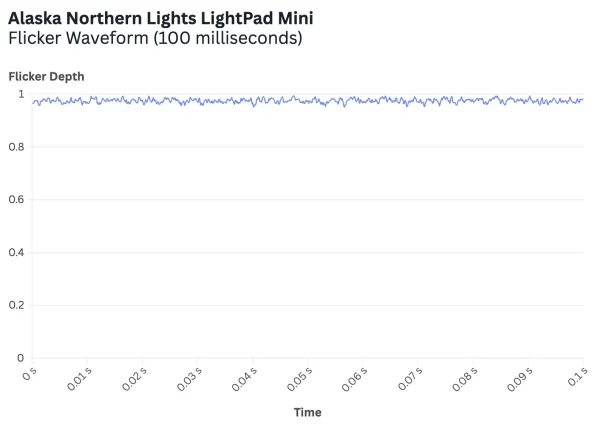 | 0.002 | 2.6% | 1 | 3 | 9.2 ft | 30W | Dimmable | Yes | Yes | Review | 100-240V | |
 | Alaska Northern Lights | Aurora LightPad Max | 380 | Check Price → | Check Price → | $$$$$ | 6550K | 30,990 | 62,715 | 29,210 | 397 | 78.1 | 78 |  | No Risk | 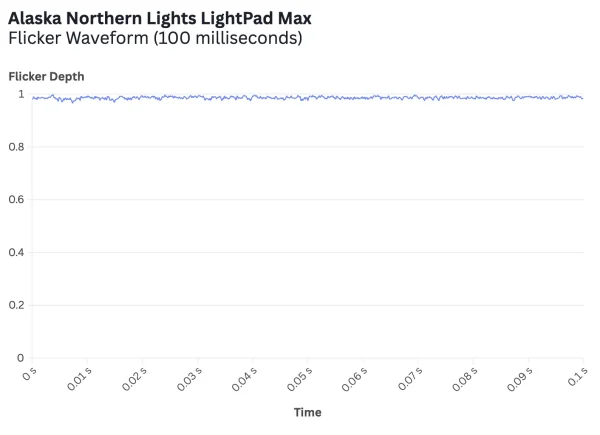 | 0.0011 | 1.8% | 1 | 3 | 8.2 ft | 47W | Dimmable | Yes | Yes | Review | 100-240V | |
 | Alaska Northern Lights | NorthStar | 335 | Check Price → | Check Price → | $$$$$ | 4350K | 16,355 | 17,900 | 9,400 | 75 | 217 | 67.9 |  | High Risk | 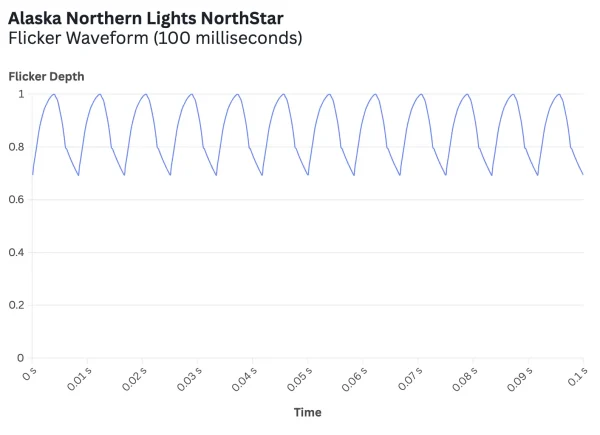 | 0.0540 | 18% | 1 | 1 | 7 ft | 100W | Smart Outlet/Timer Compatible | Yes | Yes | Review | 120V | |
 | Lumie | Halo | 249 | Check Price → | $$$$ | 3850K | 6,620 | 6,865 | 4,220 | 108 | 61.5 | 84.2 |  | No Risk |  | 0.0023 | 1% | 3 | 3 | 5.9 ft | 26W | Dimmable, Adjustable Color Temperature | No | No | Review | 100-240V | ||
 | Lumie | Vitamin L | 100 | Check Price → | $$ | 4050K | 5,730 | 6,075 | 3,750 | 91 | 63.2 | 79.3 |  | No Risk | 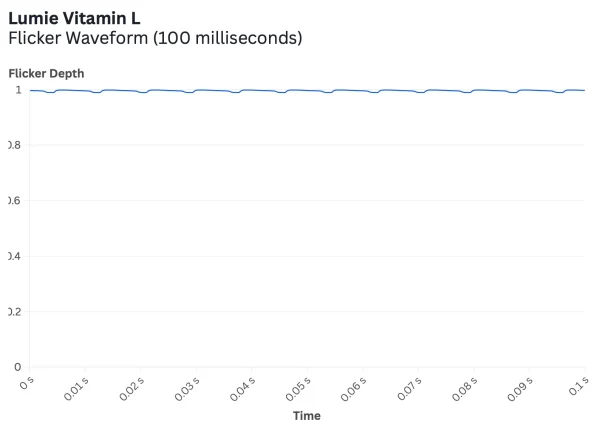 | 0.0012 | 0.5% | 1 | 1 | 5.9 ft | 23W | Smart Outlet/Timer Compatible | No | No | Review | 100-240V | ||
 | Lumie | Mini | 59 | Check Price → | $ | 3950K | 3,880 | 3,780 | 2,420 | 102 | 37.9 | 77.9 |  | No Risk | 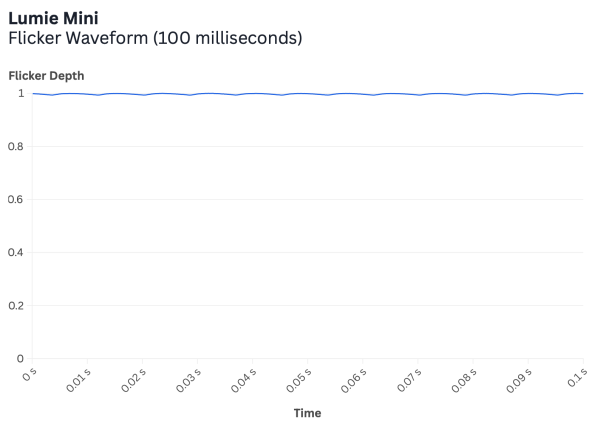 | 0.0008 | 0.4% | 1 | 1 | 5.9 ft | 13W | Smart Outlet/Timer Compatible | No | No | Review | 100-240V | ||
 | Carex | Day-Light Elite | 140 | Check Price → | Check Price → | $$ | 4150K | 12,400 | 14,190 | 7,710 | 69 | 180 | 79.5 |  | No Risk |  | 0.0003 | 0.2% | 1 | 4 | 5.2 ft | 34W | OPTIMIZE15 for 15% off | Dimmable | Yes | Yes | Review | 120V |
 | Sunrise Sensations | Brightbox | 100 | Check Price → | Check Price → | $$ | 6150K | 2,010 | 2,630 | 1,525 | 40 | 50.2 | 67.6 |  | No Risk |  | 0.0007 | 0.7% | 7 | 1 | 5.5 ft | 13W | Adjustable Color Temperature | No | No | Review | 100-240V | |
 | Sunrise Sensations | Daybright | 200 | Check Price → | Check Price → | $$$ | 6650K | 3,305 | 4,745 | 2,605 | 33 | 101.4 | 67.3 |  | No Risk |  | 0.0019 | 0.9% | 7 | 1 | 5.5 ft | 20W | Adjustable Color Temperature | No | No | Review | 100-240V | |
 | BlockBlueLight | Full Spectrum + Infrared | 430 | Check Price → | $$$$$ | 5850K | 14,595 | 27,245 | 13,830 | 2,056 | 7.1 | 97.2 |  | No Risk | 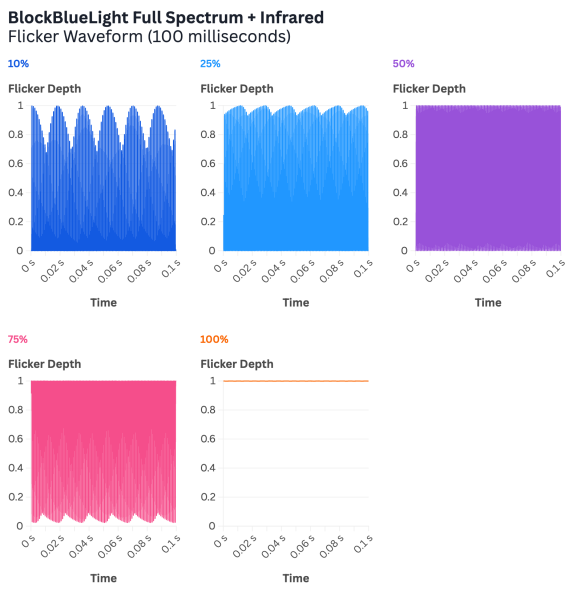 | 0.5008 | 99.8% | 1 | 5 | 10.7 ft | 47W | OPTIMIZE10 for 10% off | Dimmable, Infrared | Yes | Yes | Review | 100-240V | |
 | SOLshine | PhotoVites | 447 | Check Price → | $$$$$ | 6400K | 20,650 | 43,140 | 20,660 | 2,908 | 7.1 | 95.9 |  | No Risk |  | 0.0002 | 0.3% | 1 | 1 | 13.8 ft | 47W | OYB10 for 10% off | Infrared | Yes | Yes | Review | 100-240V | |
 | Beurer | TL 95 | 200 | Check Price → | $$$ | 6150K | 7,595 | 13,655 | 7,450 | 47 | 160.6 | 95 |  | No Risk |  | 0.0001 | 0.2% | 1 | 6 | 10.1 ft | 60W | Dimmable | No | Yes | Review | 100-240V | ||
 | Beurer | TL 30 | 40 | Check Price → | $ | 6850K | 1,940 | 2,745 | 1,740 | 52 | 37.2 | 84 |  | No Risk |  | 0.0007 | 0.3% | 1 | 1 | 4.9 ft | 9W | Smart Outlet/Timer Compatible | No | No | Review | 100-240V | ||
 | Beurer | TL 20 | 50 | Check Price → | $ | 6450K | 2,275 | 3,260 | 2,040 | 107 | 21.2 | 74.5 |  | No Risk |  | 0.0002 | 0.4% | 1 | 1 | 5.8 ft | 7W | Smart Outlet/Timer Compatible | No | No | Review | 100-240V | ||
 | Beurer | TL 35 | 60 | Check Price → | $ | 7350K | 2,775 | 4,055 | 2,485 | 188 | 14.8 | 92.3 |  | No Risk |  | 0.0002 | 0.4% | 3 | 4 | 4.5 ft | 15W | Dimmable, Adjustable Color Temperature | No | No | Review | 100-240V | ||
 | Beurer | TL 50 | 44 | Check Price → | $ | 5650K | 4,420 | 6,800 | 4,080 | 62 | 70.9 | 93.6 |  | No Risk |  | 0.0001 | 0.01% | 1 | 1 | 5.8 ft | 24W | Smart Outlet/Timer Compatible | No | No | Review | 100-240V | ||
 | Verilux | HappyLight Mini | 40 | Check Price → | $ | 4300K | 3,410 | 3,775 | 2,320 | 81.8 |  | Low Risk |  | 0.01 | 4.1% | 1 | 3 | 20W | Dimmable | No | No | 100-240V | ||||||
 | Chroma | Sky Portal 2.1 | 275 | Check Price → | $$$$ | 7400K | 5,310 | 11,485 | 6,240 | 51 | 103.9 | 85.4 |  | No Risk |  | 0.0005 | 1.4% | ∞ | ∞ | 8.6 ft | 38W | OYB10 for 10% off | Dimmable, Smart Outlet/Timer Compatible, Adjustable Color Temperature | No | Yes | Review | 100-240V | |
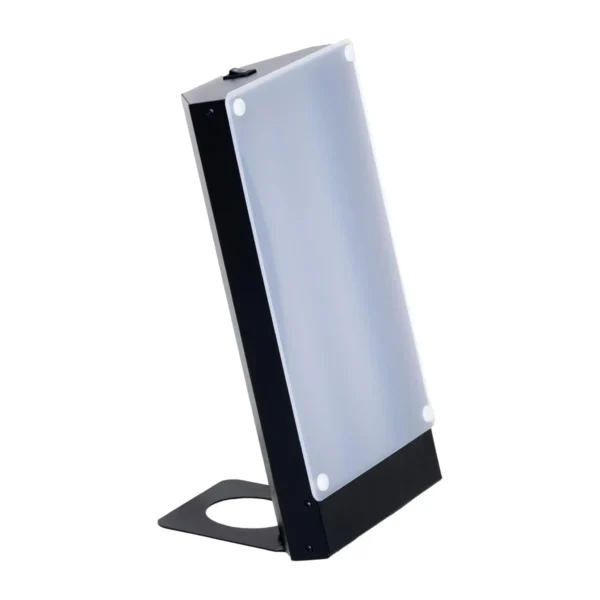 | Northern Light Technologies | TRAVelite II | 130 | Check Price → | $$ | 4200K | 7,330 | 8,505 | 4,970 | 170 | 43 | 78.4 | 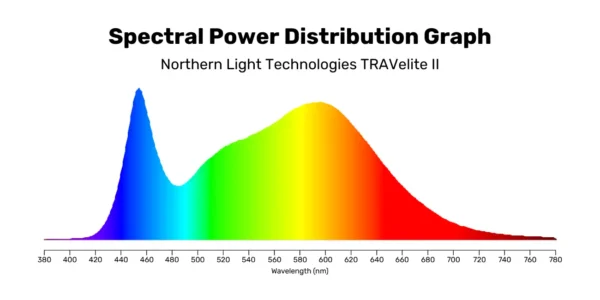 | High Risk | 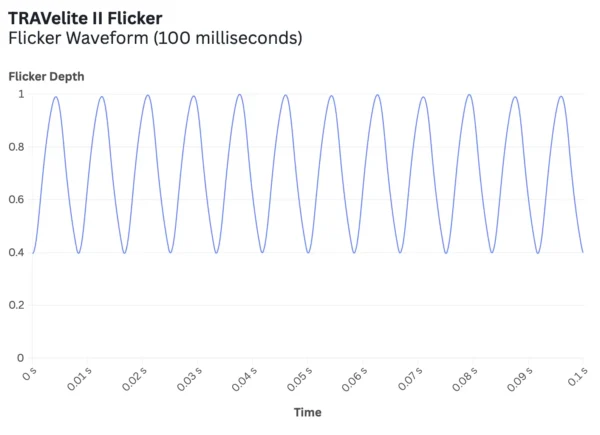 | 0.1289 | 43% | 1 | 1 | 7 ft | 34W | Smart Outlet/Timer Compatible | No | No | Review | 100-240V | ||
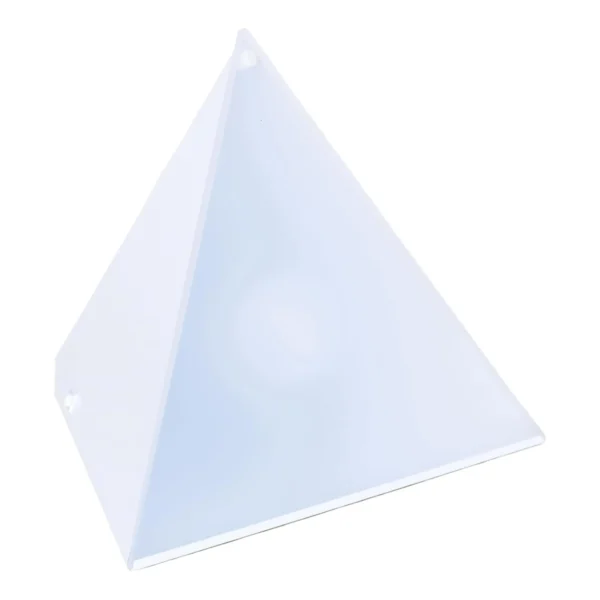 | Northern Light Technologies | LUXOR | 160 | Check Price → | $$ | 3950K | 7,340 | 7,200 | 4,330 | 92 | 80 | 75 | 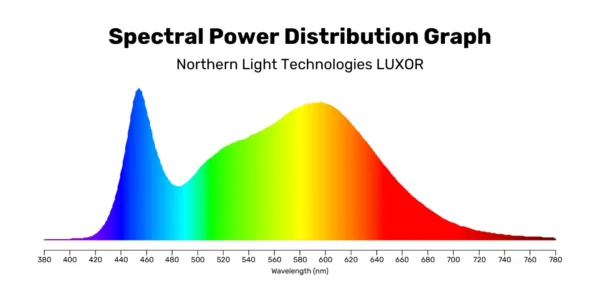 | High Risk | 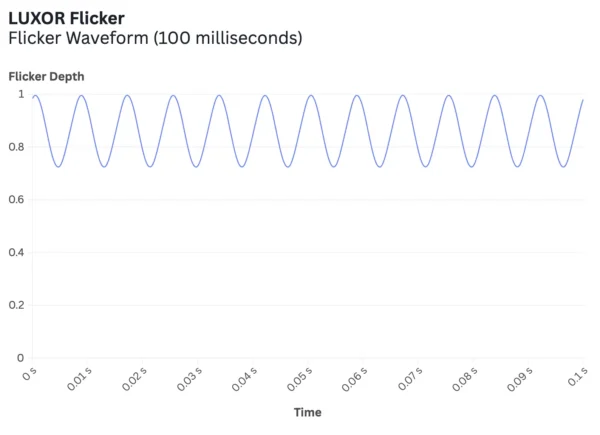 | 0.0490 | 16% | 1 | 1 | 7.6 ft | 27W | Smart Outlet/Timer Compatible | No | No | Review | 100-240V | ||
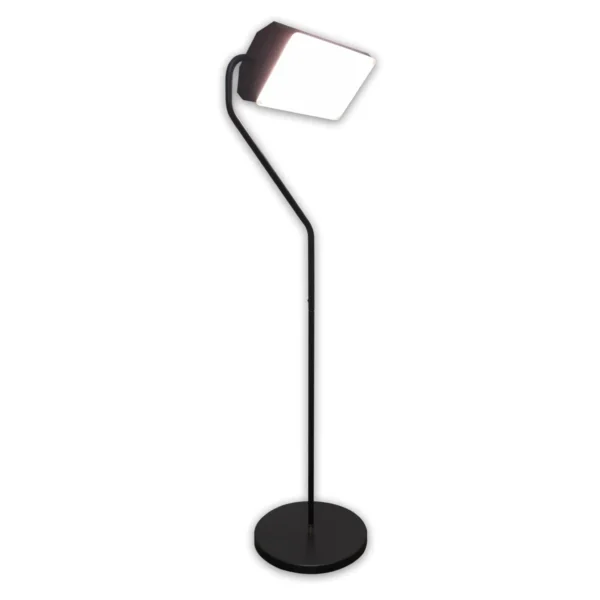 | Northern Light Technologies | FLAMINGO II | 175 | Check Price → | $$$ | 4200K | 7,240 | 8,345 | 4,890 | 168 | 43 | 78.3 | 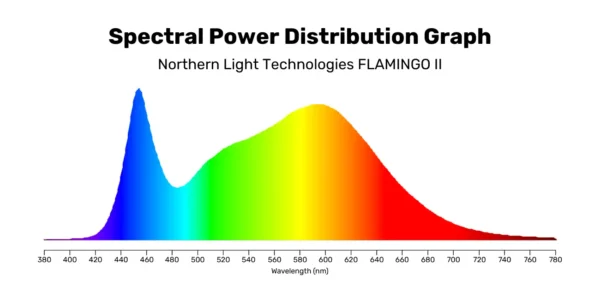 | High Risk | 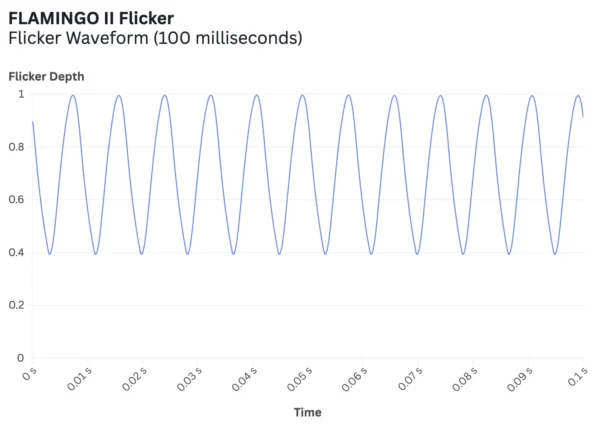 | 0.1295 | 43% | 1 | 1 | 5.8 ft | 34W | Smart Outlet/Timer Compatible | No | No | Review | 100-240V | ||
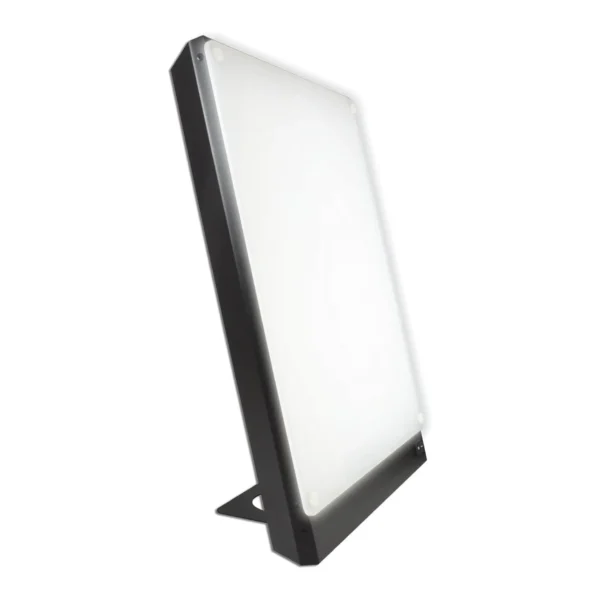 | Northern Light Technologies | BOXelite | 175 | Check Price → | $$$ | 3700K | 10,225 | 8,520 | 5,015 | 85 | 120 | 71.8 | 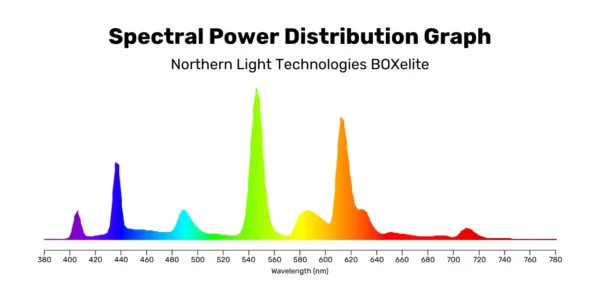 | No Risk | 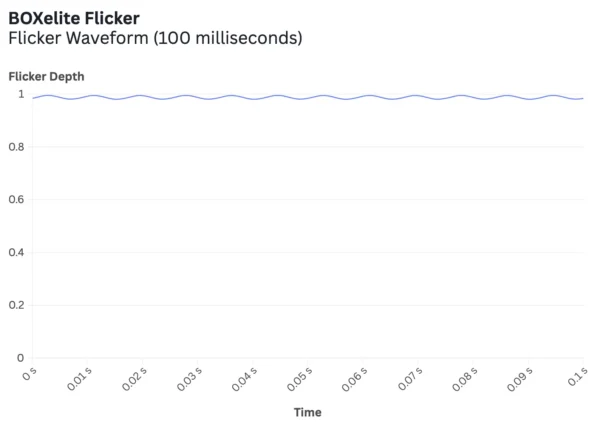 | 0.0022 | 0.8% | 1 | 1 | 7.3 ft | 70W | Smart Outlet/Timer Compatible | Yes | No | Review | 100-240V | ||
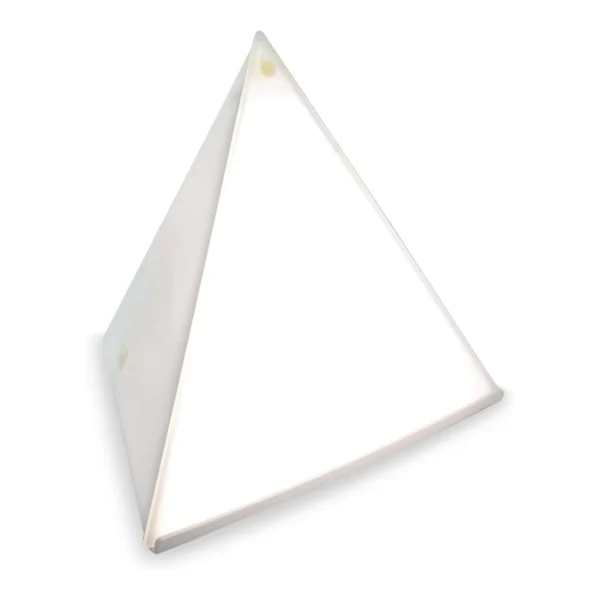 | Northern Light Technologies | Mini LUXOR | 90 | Check Price → | $$ | 4000K | 5,720 | 5,810 | 3,580 | 132 | 43.3 | 78 | 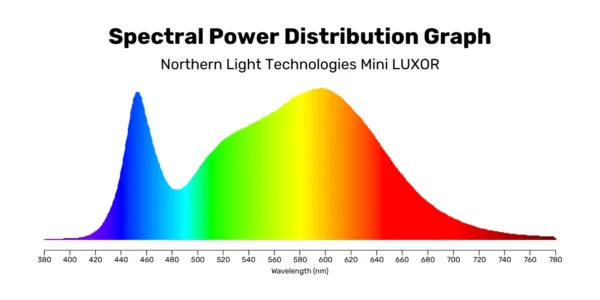 | High Risk | 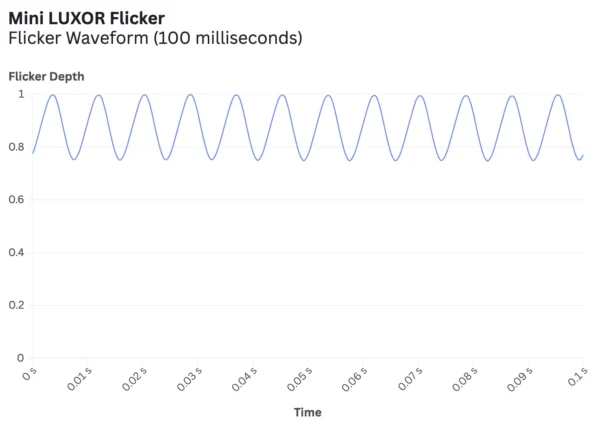 | 0.0436 | 15% | 1 | 1 | 7.6 ft | 20W | Smart Outlet/Timer Compatible | No | No | Review | 100-240V | ||
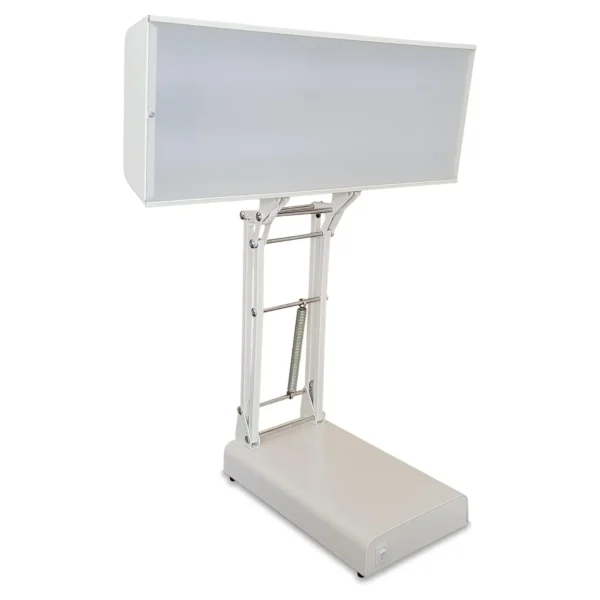 | Northern Light Technologies | NLT Desk Lamp II | 195 | Check Price → | $$$ | 4050K | 12,680 | 14,930 | 8,280 | 205 | 62 | 77.4 | 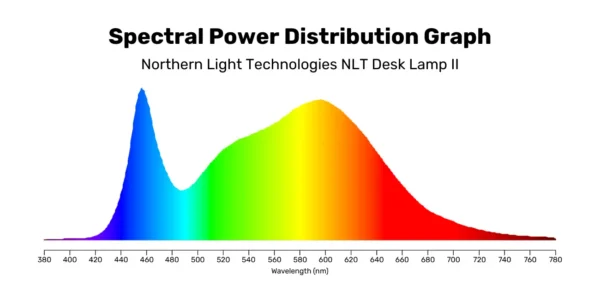 | High Risk | 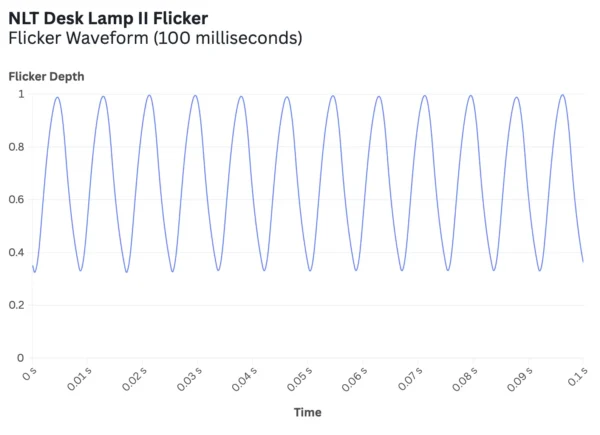 | 0.1520 | 51% | 1 | 1 | 7 ft | 45W | Smart Outlet/Timer Compatible | Yes | Yes | Review | 100-240V | ||
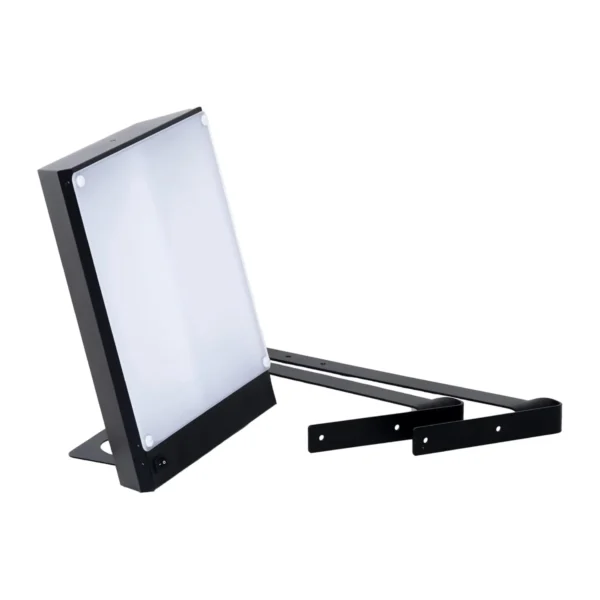 | Northern Light Technologies | LiteUP | 160 | Check Price → | $$$ | 4200K | 7,800 | 9,435 | 5,355 | 181 | 43 | 81.4 | 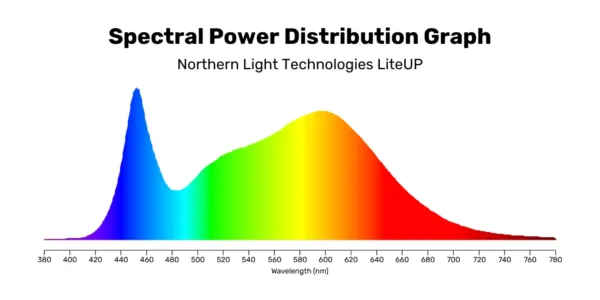 | High Risk | 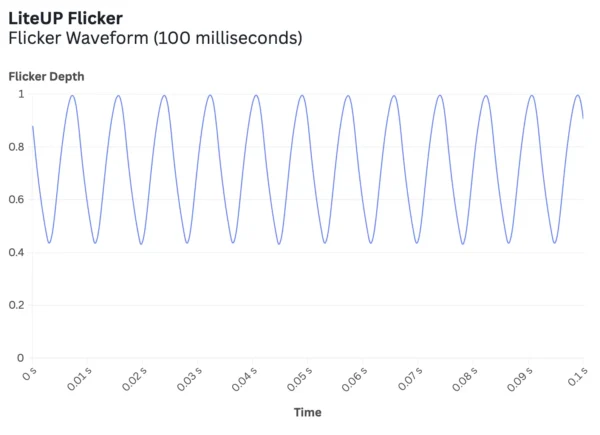 | 0.1178 | 39% | 1 | 1 | 10.3 ft | 34W | Smart Outlet/Timer Compatible | No | No | Review | 100-240V | ||
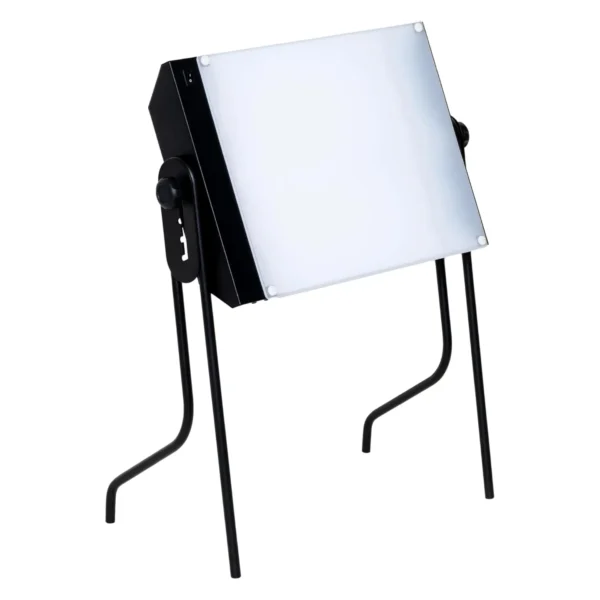 | Northern Light Technologies | BOXelite OS | 175 | Check Price → | $$$ | 3700K | 10,225 | 8,520 | 5,015 | 85 | 120 | 71.8 |  | No Risk |  | 0.0022 | 0.8% | 1 | 1 | 6.6 ft | 70W | Smart Outlet/Timer Compatible | Yes | No | Review | 100-240V | ||
 | Lastar | CM020A | 42 | Check Price → | $ | 6350K | 2,930 | 4,240 | 2,555 | 127 | 23 | 77.5 |  | No Risk | 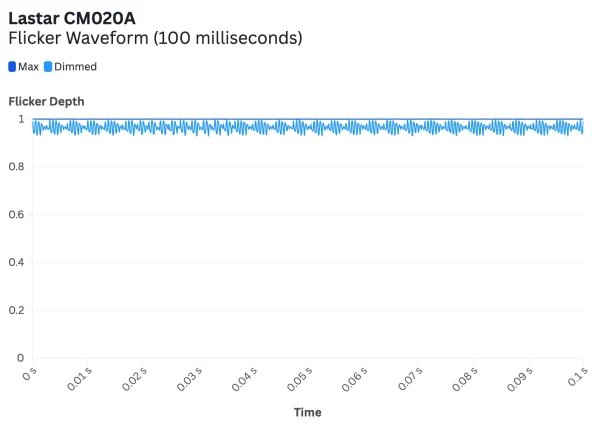 | 0.0027 | 2.8% | 4 | 5 | 6 ft | 10W | Dimmable, Adjustable Color Temperature, Smart Outlet/Timer Compatible | No | No | 100-240V | |||
 | Lastar | CM020B | 48 | Check Price → | $ | 6900K | 2,835 | 4,385 | 2,625 | 123 | 23 | 78.7 | 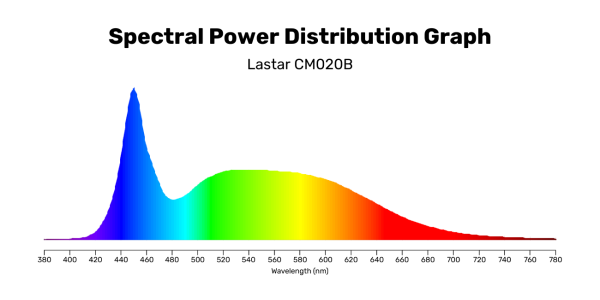 | No Risk | 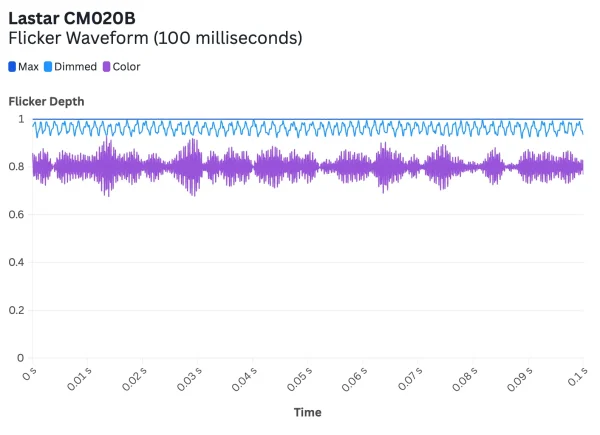 | 0.0065 | 3.8% | 4 | 5 | 6 ft | 12W | Dimmable, Adjustable Color Temperature, Smart Outlet/Timer Compatible | No | No | 100-240V | |||
 | Suxio | XZTD-01 | 20 | Check Price → | $ | 6500K | 2,265 | 2,805 | 1,645 | 88 | 25.8 | 57.6 | 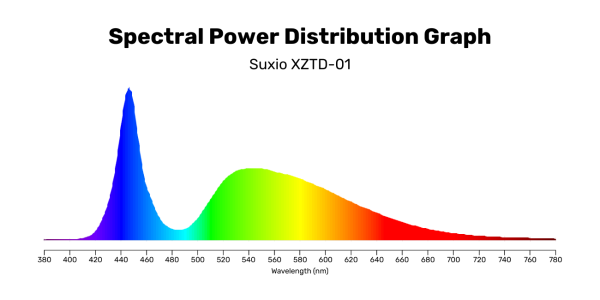 | No Risk | 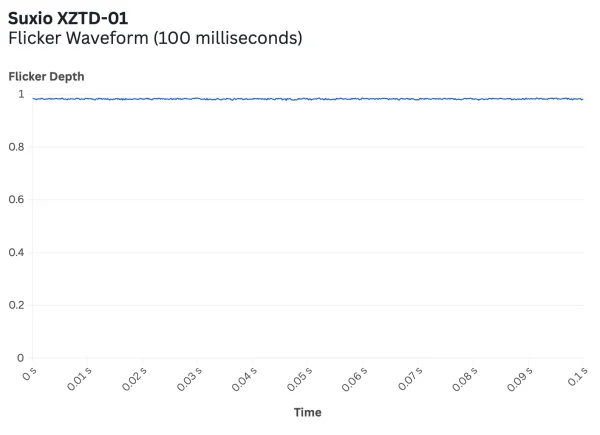 | 0.0007 | 0.6% | 1 | 3 | 5 ft | 8W | Dimmable | No | No | 100-240V | |||
 | MICROENE | M156138 | 32 | Check Price → | $ | 6900K | 4,080 | 6,645 | 3,810 | 156 | 26.2 | 78.5 | 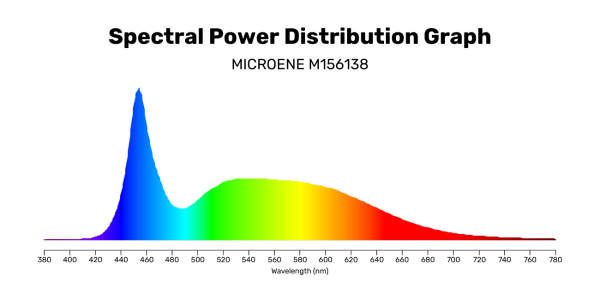 | No Risk | 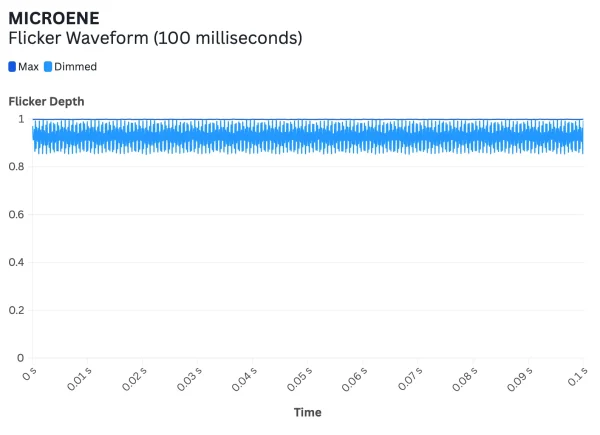 | 0.0105 | 8.8% | 1 | 5 | 6.4 ft | 12W | Dimmable, Smart Outlet/Timer Compatible | No | No | 100-240V | |||
 | Fitfirst | ML-L001 | 30 | Check Price → | $ | 6300K | 2,160 | 3,055 | 1,890 | 58 | 37.3 | 75.7 |  | No Risk | 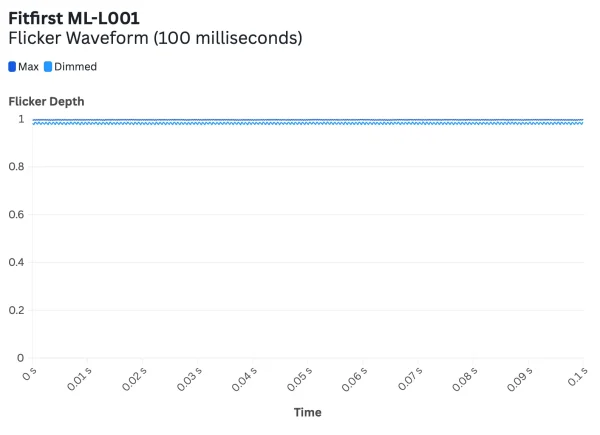 | 0.0023 | 1.6% | 3 | 4 | 3.8 ft | 13W | Dimmable, Adjustable Color Temperature | No | No | 100-240V | |||
 | Erligpowht | LQ-05 | 25 | Check Price → | $ | 6500K | 2,080 | 3,020 | 1,990 | 105 | 19.8 | 92.2 | 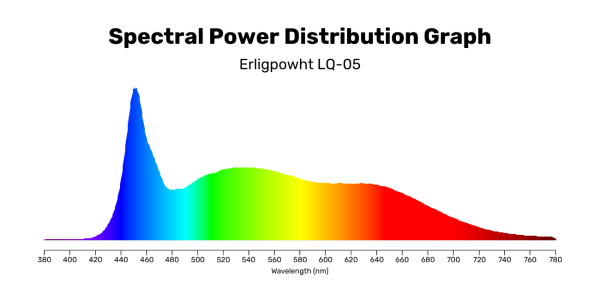 | No Risk | 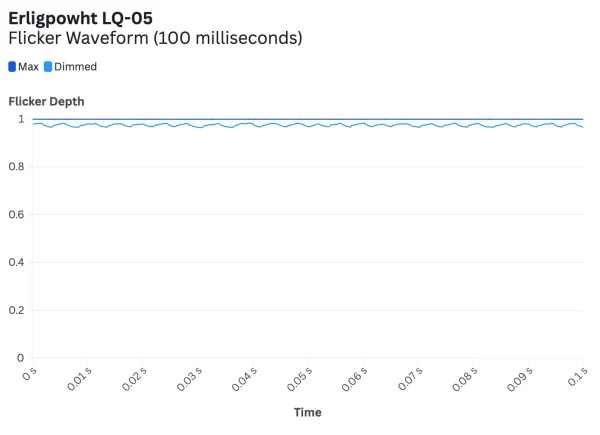 | 0.0016 | 1.1% | 1 | 3 | 4.8 ft | 17W | Dimmable | No | No | 100-240V | |||
 | SMY Lighting | LTL-101G-WHI | 50 | Check Price → | $ | 10000K | 365 | 4,065 | 2,650 | 11 | 34.4 | N/A | 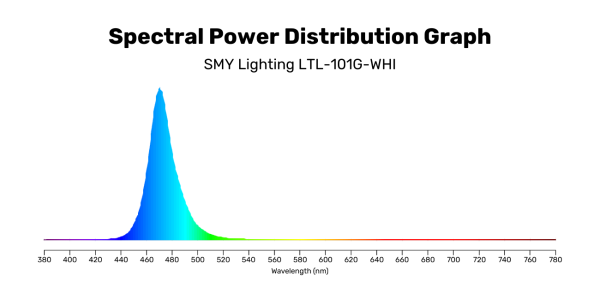 | No Risk | 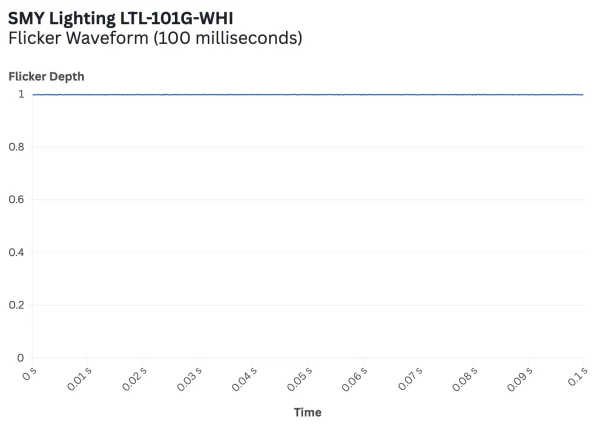 | 0.0001 | 0.2% | 1 | 2 | 5 ft | 4W | Dimmable | No | No | 100-240V | |||
 | Pure Guardian Spa | SPA50 | 60 | Check Price → | $ | 5600K | 4,740 | 6,925 | 3,965 | 109 | 43.4 | 84.8 | 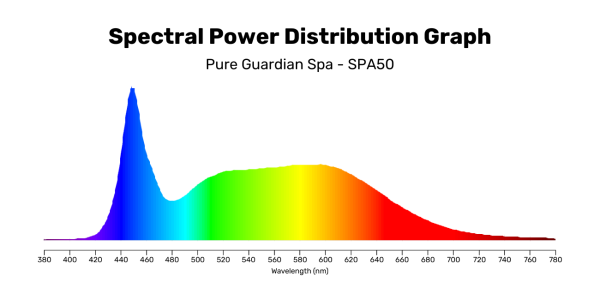 | High Risk | 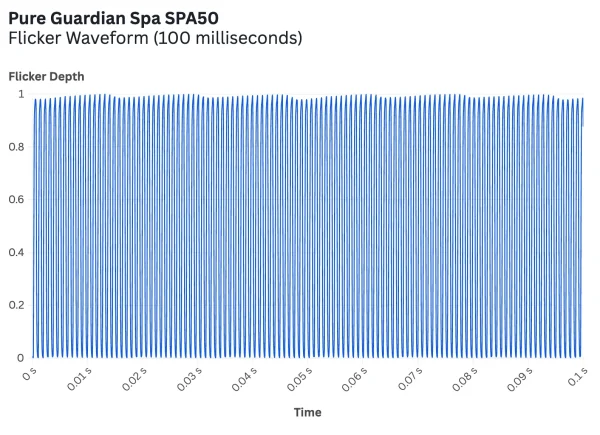 | 0.2829 | 88.1% | 2 | 3 | 6.6 ft | 14W | Dimmable, Adjustable Color Temperature | No | No | 100-240V | |||
 | BAOMING | BL-HAPPYCFV-23W | 58 | Check Price → | $ | 10000K | 1,920 | 24,960 | 12,800 | 37 | 51.8 | 92.5 | 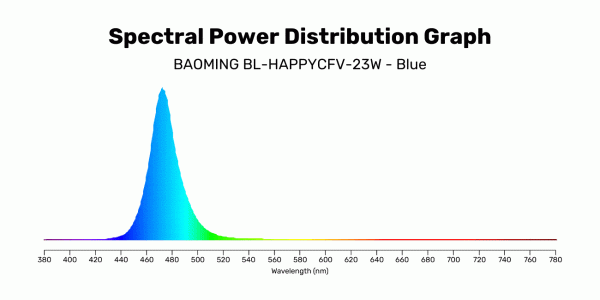 | No Risk | 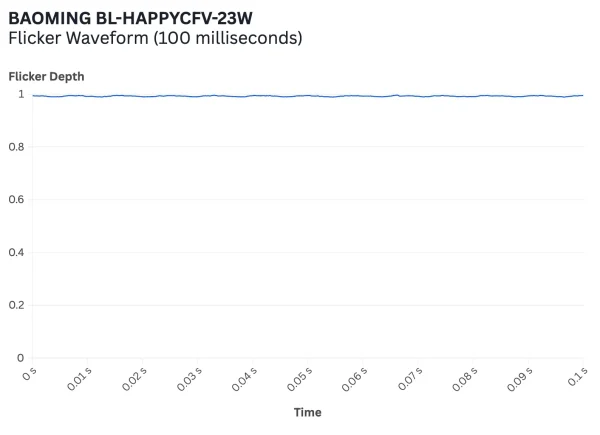 | 0.0007 | 0.4% | 2 | 5 | 5 ft | 21W | Dimmable, Adjustable Color Temperature | No | Yes | 100-240V | |||
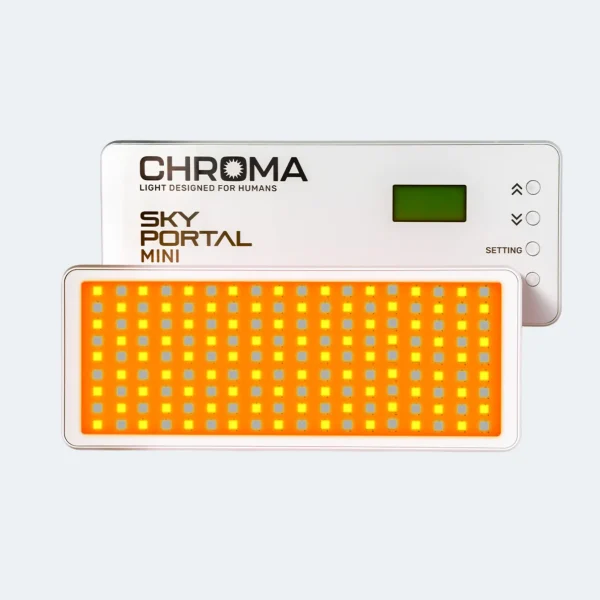 | Chroma | Sky Portal Mini | 275 | Check Price → | $$$$ | 5550K | 3,460 | 6,135 | 3,535 | 223 | 15.5 | 83 | 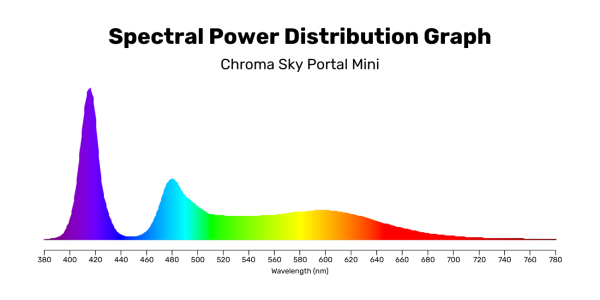 | No Risk | 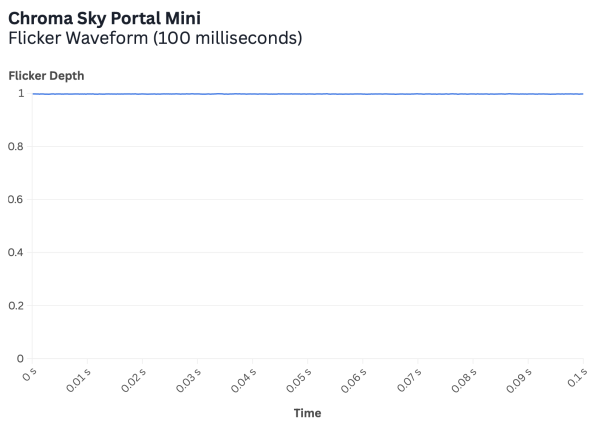 | 0.0001 | 0.1% | 21 | 20 | 3.2 ft | 10W | OYB10 for 10% off | Battery Powered | No | No | Review | 100-240V | |
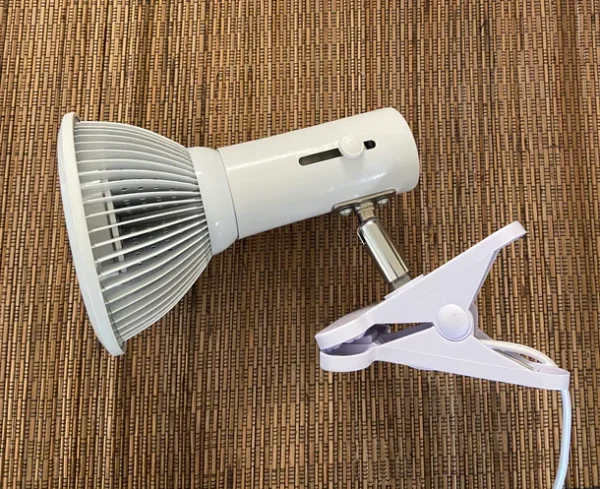 | SOLShine | BioBulb | 147 | Check Price → | $$ | 8050K | 31,285 | 77,785 | 35,470 | 94.6 | 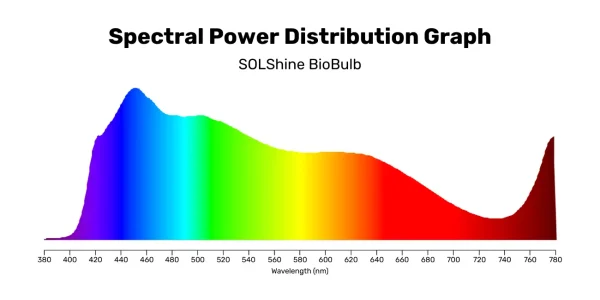 | No Risk | 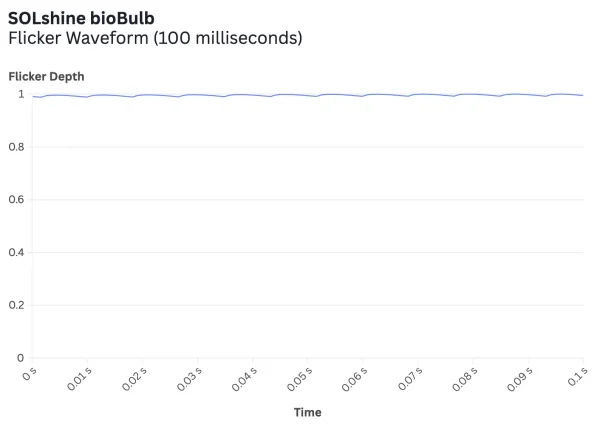 | 0.0011 | 0.8% | 1 | 1 | OYB10 for 10% off | Smart Outlet/Timer Compatible | Yes | Yes | Review | 120-240V | |||||
| Circadian Optics | Langham Max | 5800K | 28,125 | 55,580 | 26,610 | 112 | 251.3 | 97.6 | 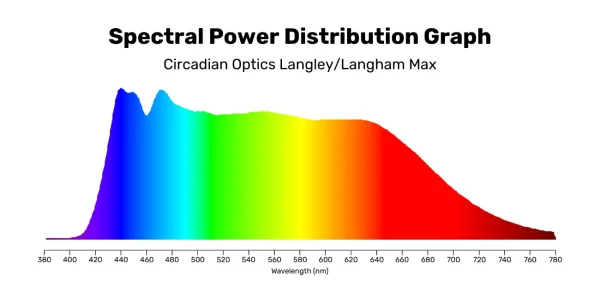 | No Risk | 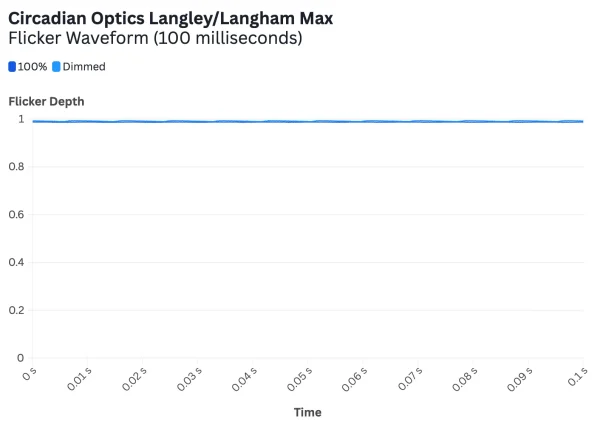 | 0.0007 | 0.3% | 1 | ∞ | 9.3 ft | 145W | Dimmable, Smart Outlet/Timer Compatible | Yes | Yes | 100-240V | |||||||
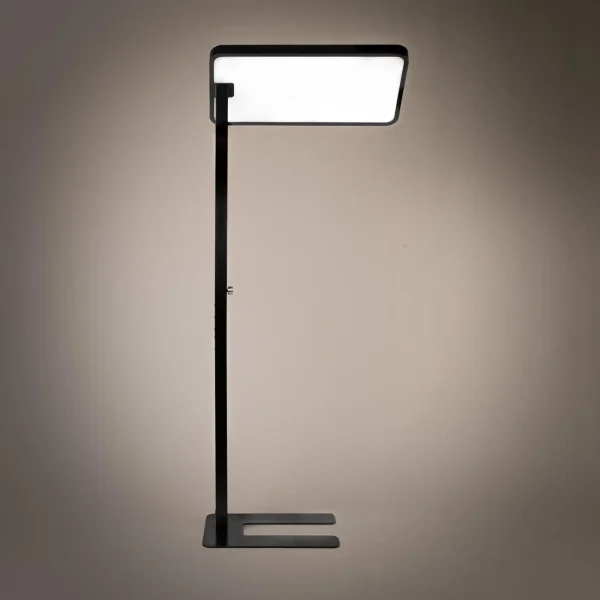 | Circadian Optics | Langley | 200 | Check Price → | Check Price → | $$$ | 5800K | 28,125 | 55,580 | 26,610 | 112 | 251.3 | 97.6 |  | No Risk |  | 0.0007 | 0.3% | 1 | ∞ | 9.3 ft | 145W | Dimmable, Smart Outlet/Timer Compatible | Yes | Yes | 100-240V | ||
| Circadian Optics | Langham | 5700K | 14,120 | 26,220 | 13,360 | 162 | 87.1 | 95.4 | 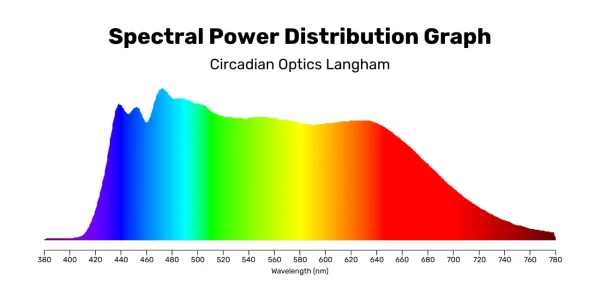 | No Risk | 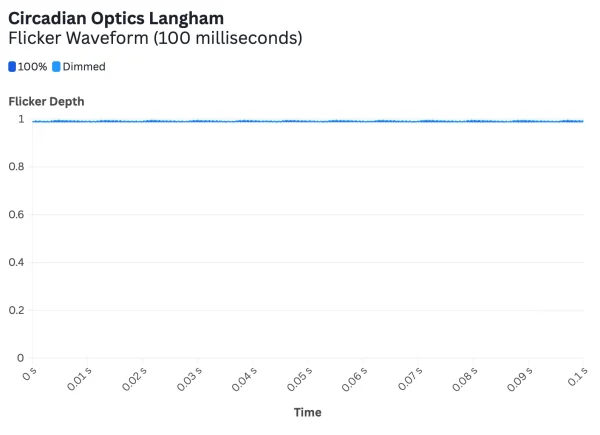 | 0.0008 | 0.6% | 1 | ∞ | 9.3 ft | 66W | Dimmable, Smart Outlet/Timer Compatible | Yes | Yes | 100-240V | |||||||
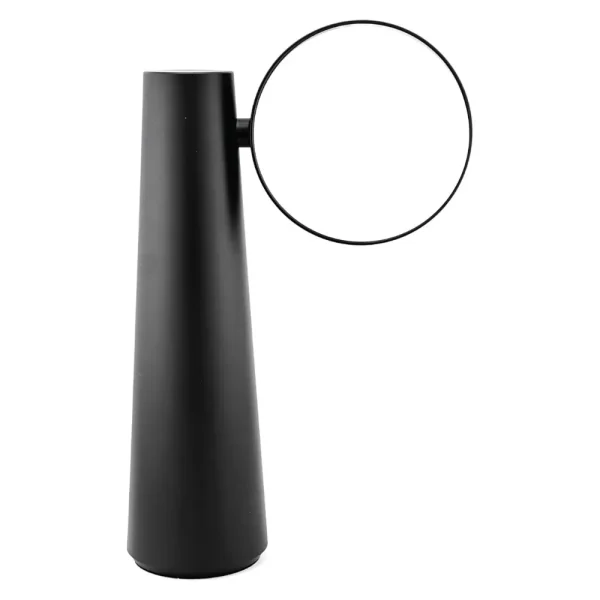 | Circadian Optics | Lora | 55 | Check Price → | Check Price → | $ | 6250K | 4,050 | 6,215 | 3,510 | 409 | 9.9 | 79.9 | 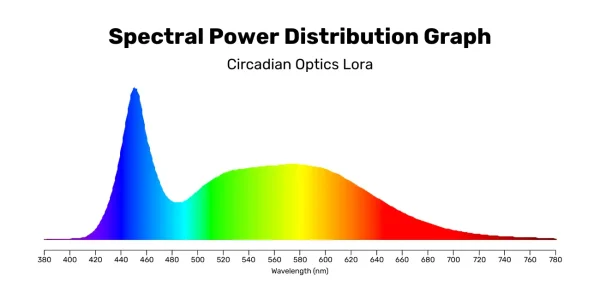 | No Risk | 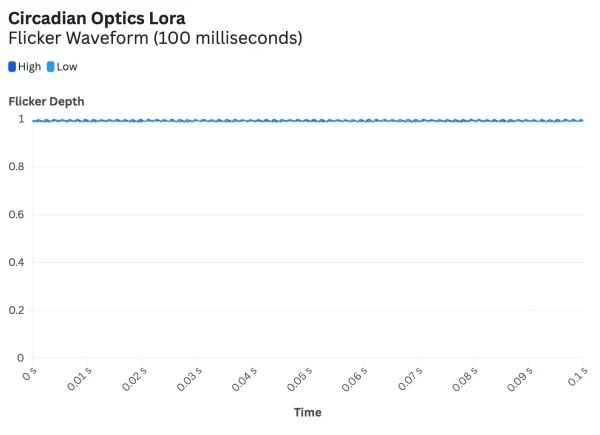 | 0.0041 | 2.7% | 1 | 3 | 7.2 ft | 15W | Dimmable | No | No | 100-240V |


Leave a Reply