💡 The Light Bulb Database
Find the healthiest light bulbs for your home with the world’s largest database! The desktop experience is recommended.
Learn more about the color quality aspects of lighting:
We just got our hands on a new spectrometer and we’re getting a professional-grade integration sphere.
This will allow us to get more accurate spectral data, including LUMENS! No more of this “800 lumens” nonsense you see on every single light bulb package…
We will be retesting every light we’ve tested so far, and many many more.
A light’s color temperature is essentially a description of how humans perceive the overall hue of a light source. The color of natural sunlight varies throughout the day, however, it hovers around 5700K for most of the day.
Some lights in our database differ greatly from the manufacturer’s stated CCT, we’ve included our measurements so that you know what you’re buying.
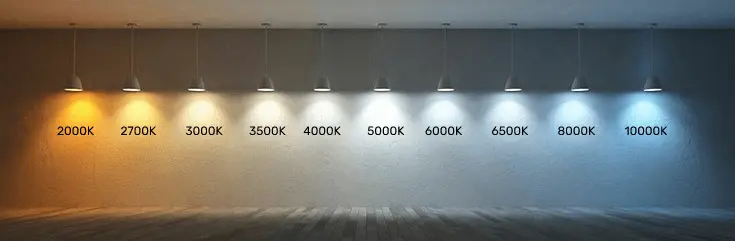
As evening and night roll around, low/no blue light sources with warm color temperatures are ideal, think <2200K.
CRI (Color Rendering Index)
CRI is a unit used to represent the ability of a light source to reflect the true colors of objects, compared to a natural light source, like the Sun.
It’s currently the most popular way of determining the color quality of an artificial light source and can be seen on many light bulb packages.
For CRI, a score of over 90 is considered good, however, I prefer to see over 95 for this metric.

A little dirt on CRI: CRI used to comprise only 8 colors. The average of these would be called the “Ra” or the average R-value. The CRI standard has since added 6 more colors, however, one of them, R9 (deep red) is more difficult to get high scores on. So most companies still only use the first 8 to calculate their “CRI score”.
We use an average of all 15 colors in our calculations, so the CRI score may be lower or higher than what is typically advertised for each light.
TM-30 (Rf and Rg)
TM-30 was created in 2015 and is a new alternative to the CRI standard.
While CRI only measures 8 to 15 colors for its average score, TM-30 uses 99 total colors.

The TM-30 gives us three important metrics:
- Rf or Fidelity: This is a number of 1 – 100 that measures the reflected light accuracy compared to a standard, similar to CRI.
- Rg or Gamut: This number shows how saturated a light source is on average. A number higher than 100 indicates it’s slightly over-saturated, while a number under 100 indicates under-saturation.
- Color Vector Graphic: Finally we get the CVG, which gives us a visual representation of color saturation.

If you’re at all concerned about how similar your light is to sunlight, the only current metric to measure this is the ASD unit developed by Bridgelux.
ASD measures how much a light source varies from a blackbody radiation curve of the same color temperature.

As you can see above, even though all the light sources are 3000K, the ASD percentage is higher for lights that are less similar to the black body curve.
The ASD metric should only be used to compare lights of the same color temperature.
If you’d like to read more, Bridgluxe’s ASD whitepaper is quite an informative read.
Almost all lights have an “invisible flicker”, if this bothers you, our database has lots of info to help you choose flicker-free lighting.
The flicker depth shows how much the brightness of a light source varies from its minimum brightness to its maximum brightness.
For example, a light source that varies from 100 lux to 80 lux, would have a flicker depth of 20%.
Generally speaking, we want this to be as low as possible, as sunlight doesn’t flicker at all.
The waveform graph actually shows you the flicker depth plotted on a 24 ms time slot.

Waveforms can vary dramatically from one light to the next.
It’s possible to associate headaches with certain types of waveforms, so if this is you, you can use this graph to decide which lights might irritate you and which might not.
This graph is based on the IEEE’s PAR1789 flicker standard.
While this standard isn’t perfect, it’s the best we’ve got right now.
This graph essentially takes the flicker frequency, seen in the waveform graph, and plots it against the flicker depth.
The idea here is that the lower the frequency and the higher the depth, the more likely a light source is to cause noticeable biological problems.

The Flicker index is a measurement that takes into account the areas above and under the light’s average output and calculates this as a number.
This gives us a good numerical value for how much time the light source spends away from the median brightness level.

Show Your Support 😄
Your support makes it possible for us to keep testing!
The Light Bulb Database
Our work is reader-supported; if you buy through our links, we may earn an affiliate commission.
| Brand | Model | Amazon | Website | CCT | CCT (After 1 hour) | Lumens | Watts | Base | Shape | Dimmable | Flicker Risk | Flicker Graph | Waveform | Flicker Index | Flicker Depth | CRI | Rf | Rg | ASD | Finish | Spectrum | Coupon Code | ||||
|---|---|---|---|---|---|---|---|---|---|---|---|---|---|---|---|---|---|---|---|---|---|---|---|---|---|---|
| GE | Sun Filled | Check Price → | 2700K | 2700K | 2800K | 850 | 10.5W | E26 | A21 | Yes | High Risk |  |  | 0.0515 | 17.7% | 96.1 | 95 | 102 | 13.2% | Plastic |  | 2/4/2023 | Link | |||
| GE | Sun Filled | Check Price → | 5000K | 5000K | 5150K | 850 | 10.5W | E26 | A21 | Yes | High Risk |  |  | 0.0402 | 13.6% | 97.7 | 98 | 101 | 8.4% | Plastic |  | 2/4/2023 | Link | |||
| Norb | Smile | Check Price → | 5000K | 5000K | 5250K | 800 | 11W | E26 | A19 | Yes | High Risk |  |  | 0.0865 | 28.6% | 97.3 | 98 | 100 | 8.2% | Plastic |  | 2/3/2023 | Link | |||
| Norb | Smile Soft | Check Price → | 4000K | 4000K | 4250K | 800 | 11W | E26 | A19 | Yes | High Risk |  |  | 0.0890 | 28.1% | 98 | 97 | 100 | 9.7% | Plastic |  | 2/2/2023 | Link | |||
| Norb | Everyday-Sun | Check Price → | 5000K | 5000K | 4900K | 800 | 9W | E26 | A19 | Yes | High Risk |  |  | 0.0545 | 20.7% | 89.9 | 91 | 97 | 12.7% | Plastic |  | 2/2/2023 | Link | |||
| Norb | Everyday-Sun Soft | Check Price → | 4000K | 4000K | 4050K | 800 | 9W | E26 | A19 | Yes | High Risk |  |  | 0.0606 | 22.3% | 92.3 | 91 | 97 | 13.3% | Plastic |  | 2/2/2023 | Link | |||
| Sylvania | Natural | Check Price → | 5000K | 5000K | 5450K | 800 | 8W | E26 | A19 | Yes | No Risk |  |  | 0.0045 | 4.1% | 90.9 | 89 | 96 | 19% | Frosted Glass |  | Feb/18/2023 | Link | |||
| Philips | Ultra Definition | Check Price → | 5000K | 5000K | 4850K | 800 | 8W | E26 | A19 | Yes | No Risk |  |  | 0.0030 | 1.7% | 94.7 | 92 | 97 | 20.3% | Frosted Glass |  | 2/4/2023 | Link | |||
| Philips | Ultra Definition | Check Price → | 5000K | 5000K | 5350K | 1100 | 11W | E26 | A21 | Yes | Low Risk |  |  | 0.0109 | 5.5% | 95.5 | 91 | 97 | 23.9% | Frosted Glass |  | 2/4/2023 | Link | |||
| Flash Pu | Z0850Pro | Check Price → | 5000K | 5000K | 5200K | 530 | 8W | E27 | A19 | No | No Risk | 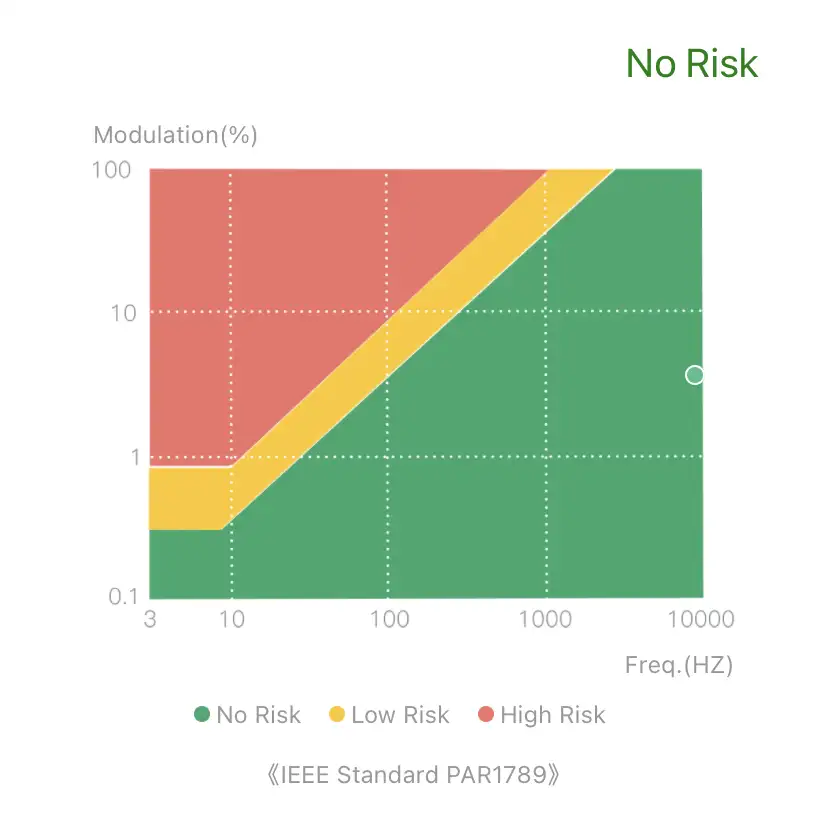 |  | 0.0110 | 3.7% | 97.1 | 96 | 98 | 5.1% | Plastic |  | 2/2/2023 | Link | |||
| Flash Pu | Z0855Pro | Check Price → | 5500K | 5500K | 5750K | 530 | 8W | E27 | A19 | No | No Risk |  |  | 0.0121 | 4.2% | 97.1 | 96 | 98 | 4.9% | Plastic |  | 2/2/2023 | Link | |||
| Waveform | Candelabra | Check Price → | 2400K | 2400K | 2500K | 450 | 5.5W | E12 | CA11 | Yes | No Risk |  |  | 0.0060 | 1.9% | 96 | 94 | 99 | 17.2% | Clear Glass |  | 2/5/2023 | Link | |||
| Waveform | Lux24 | Check Price → | 2400K | 2400K | 2450K | 450 | 5W | E26 | A19 | Yes | No Risk |  |  | 0.0027 | 0.9% | 90.7 | 92 | 97 | 20% | Clear Glass |  | 2/5/2023 | Link | |||
| Waveform | D50 | Check Price → | 5000K | 5000K | 5150K | 800 | 10W | E26 | A19 | No | No Risk |  |  | 0.0032 | 1.3% | 95.9 | 95 | 103 | 14.6% | Plastic |  | Feb/05/2023 | Link | |||
| Waveform | Centric Daylight | Check Price → | 5000K | 5000K | 5100K | 1600 | 15W | E26 | A21 | No | No Risk |  |  | 0.0334 | 10.9% | 96.2 | 95 | 103 | 14.6% | Plastic |  | Feb/06/2023 | Link | |||
| Waveform | Superwarm | Check Price → | 1700K | 1700K | 1700K | 600 | 10W | E26 | A19 | No | No Risk |  |  | 0.0154 | 5.1% | 79.7 | 87 | 90 | 22.4% | Plastic |  | Feb/06/2023 | Link | |||
| Waveform | FilmGrade | Check Price → | 5600K | 5600K | 5800K | 800 | 10W | E26 | A19 | No | No Risk |  |  | 0.0058 | 1.8% | 92.9 | 91 | 99 | 14.5% | Plastic |  | Feb/06/2023 | Link | |||
| Norb | Smart | Check Price → | Variable | 2650-5000K | Variable | 806 | 9W | E26 | A19 | Yes | High Risk |  |  | 0.0561 | 19.1% | 94.2 | 91 | 97 | 12.2% | Plastic |  | Feb/07/2023 | Link | |||
| Tuo | Circadian | Check Price → | Variable | 2400-6500K | Variable | Variable | 9W | E26 | A21 | Yes | High Risk |  |  | 0.6281 | 99.5% | 79.5 | 84 | 98 | 33.2% | Plastic |  | Feb/07/2023 | Link | |||
| GE | Sun Filled | Check Price → | 2700K | 2700K | 2750K | 680 | 8.5W | E26 | BR30 | Yes | High Risk |  |  | 0.0634 | 20.9% | 96 | 96 | 101 | 12.8% | Plastic |  | Feb/07/2023 | Link | |||
| GE | Vintage | Check Price → | 2200K | 2200K | 2150K | 280 | 4.5W | E26 | G25 | Yes | High Risk |  |  | 0.0134 | 11.6% | 77.1 | 84 | 93 | 29.3% | Amber Glass |  | Feb/07/2023 | Link | |||
| GE | Vintage | Check Price → | 2200K | 2200K | 2200K | 400 | 5.5W | E26 | G25 | Yes | High Risk |  |  | 0.0424 | 30.4% | 79.3 | 85 | 93 | 28% | Amber Glass |  | Feb/08/2023 | Link | |||
| GE | Vintage | Check Price → | 2150K | 2150K | 2150K | 560 | 6W | E26 | A19 | Yes | High Risk |  |  | 0.0789 | 30.7% | 78.2 | 85 | 94 | 27.5% | Amber Glass |  | Feb/08/2023 | Link | |||
| GE | Vintage | 2150K | 2150K | 2250K | 240 | 3.5W | E26 | A15 | Yes | High Risk |  |  | 0.0455 | 18.9% | 81 | 86 | 96 | 27.8% | Amber Glass |  | Feb/08/2023 | Link | ||||
| GE | Vintage | Check Price → | 2000K | 2000K | 2050K | 125 | 3W | E26 | A15 | Yes | No Risk |  |  | 0.0046 | 2.4% | 79.3 | 84 | 91 | 27.4% | Amber Glass |  | Feb/08/2023 | Link | |||
| GE | Vintage | Check Price → | 2000K | 2000K | 2150K | 250 | 5W | E26 | ST19 | Yes | High Risk |  |  | 0.0202 | 20.3% | 85 | 87 | 95 | 26.7% | Amber Glass |  | Feb/08/2023 | Link | |||
| GE | Vintage | Check Price → | 2200K | 2200K | 2200K | 250 | 5W | E26 | ST19 | Yes | High Risk |  |  | 0.0222 | 24.1% | 81.1% | 87 | 98 | 27.6% | Clear Glass |  | Feb/08/2023 | Link | |||
| Philips | Ultra Definition | Check Price → | 2700K | 2700K | 2850K | 450 | 5W | E26 | A15 | Yes | Low Risk |  |  | 0.0079 | 6.6% | 95.5 | 94 | 101 | 25.1% | Clear Glass |  | Feb/08/2023 | Link | |||
| Philips | Ultra Definition | Check Price → | 2700K | 2700K | 2800K | 450 | 5.5W | E26 | R20 | Yes | No Risk |  |  | 0.0051 | 3.8% | 89.8 | 93 | 98 | 20.8% | Frosted Glass |  | Feb/09/2023 | Link | |||
| Philips | Ultra Definition | Check Price → | 2700K | 2700K | 2850K | 800 | 8W | E26 | A19 | Yes | No Risk |  |  | 0.0042 | 2.4% | 95.9 | 95 | 102 | 25.2% | Clear Glass |  | Feb/09/2023 | Link | |||
| Philips | Ultra Definition | 2700K | 2700K | 2800K | 450 | 5W | E26 | A19 | Yes | No Risk |  |  | 0.0044 | 2.8% | 93.7 | 94 | 103 | 28.3% | Clear Glass |  | Feb/09/2023 | Link | ||||
| Philips | Vintage | Check Price → | 2000K | 2000K | 2050K | 225 | 3.5W | E12 | B11 | Yes | No Risk |  |  | 0.0039 | 3.5% | 77.5 | 84 | 93 | 29.8% | Amber Glass |  | Feb/10/2023 | Link | |||
| Philips | Vintage | Check Price → | 2000K | 2000K | 2050K | 225 | 3.5W | E26 | A15 | Yes | Low Risk |  |  | 0.0054 | 4.8% | 77.1 | 84 | 94 | 28.9% | Amber Glass |  | Feb/10/2023 | Link | |||
| Philips | Ultra Definition | Check Price → | 2700K | 2700K | 2650K | 1600 | 13.5W | E26 | A21 | Yes | Low Risk |  |  | 0.0124 | 5.5% | 94.9 | 94 | 102 | 27.9% | Clear Glass |  | Feb/10/2023 | Link | |||
| Hooga | Red Sleep | Check Price → | 1000K | 1000K | 1000K | 180 | 7W | E26 | A21 | No | No Risk |  |  | 0.0248 | 8.4% | N/A | N/A | N/A | N/A | Frosted Plastic |  | Feb/10/2023 | Link | Use coupon code OPTIMIZE12 | ||
| Philips | Ultra Definition | Check Price → | 2700K | 2700K | 2700K | 1100 | 11W | E26 | A21 | Yes | No Risk |  |  | 0.0047 | 2.3% | 95.3 | 94 | 101 | 30% | Frosted Glass |  | Feb/11/2023 | Link | |||
| Philips | Ultra Definition | Check Price → | 2700K | 2700K | 2750K | 800 | 8W | E26 | A19 | Yes | No Risk |  |  | 0.0049 | 2.8% | 95.8 | 95 | 101 | 23% | Frosted Glass |  | Feb/11/2023 | Link | |||
| Philips | Vintage | Check Price → | 2000K | 2000K | 2000K | 400 | 6.5W | E26 | A19 | Yes | High Risk |  |  | 0.0554 | 27.2% | 76.5 | 84 | 95 | 28.7% | Amber Glass |  | Feb/11/2023 | Link | |||
| Philips | Ultra Definition | 2700K | 2700K | 2800K | 500 | 5W | E26 | G25 | Yes | Low Risk |  |  | 0.0088 | 6.4% | 95.9 | 95 | 101 | 25.2% | Clear Glass |  | Feb/11/2023 | Link | ||||
| Philips | Ultra Definition | 2700K | 2700K | 2800K | 185 | 2.3W | E12 | BA11 | Yes | No Risk |  |  | 0.0042 | 2.3% | 96.1 | 95 | 99 | 21.6% | Clear Glass |  | Feb/11/2023 | Link | ||||
| Philips | Ultra Definition | Check Price → | 5000K | 5000K | 5250K | 750 | 6.6W | E26 | A15 | Yes | Low Risk |  |  | 0.0073 | 7.6% | 95.7 | 91 | 98 | 26.3% | Clear Glass |  | Feb/11/2023 | Link | |||
| Philips | Ultra Definition | Check Price → | 2700K | 2700K | 2750K | 650 | 7.5W | E26 | BR30 | Yes | Low Risk |  |  | 0.0172 | 7.3% | 92.7 | 94 | 99 | 20.8% | Frosted Plastic |  | Feb/11/2023 | Link | |||
| Philips | Ultra Definition | Check Price → | 5000K | 5000K | 5250K | 1600 | 13.5W | E26 | A21 | Yes | High Risk |  |  | 0.0291 | 12.3% | 95.3 | 91 | 98 | 23% | Clear Glass |  | Feb/11/2023 | Link | |||
| Philips | Ultra Definition | Check Price → | 5000K | 5000K | 5300K | 450 | 5W | E26 | A19 | Yes | Low Risk |  |  | 0.0074 | 7.1% | 96 | 93 | 98 | 22.9% | Frosted Glass |  | Feb/11/2023 | Link | |||
| Philips | Ultra Definition | Check Price → | 5000K | 5000K | 5250K | 650 | 7.5W | E26 | BR30 | Yes | Low Risk |  |  | 0.0120 | 4.9% | 95.7 | 95 | 100 | 19.5% | Frosted Plastic |  | Feb/12/2023 | Link | |||
| Philips | Ultra Definition | Check Price → | 5000K | 5000K | 5150K | 500 | 5W | E26 | G25 | Yes | Low Risk |  |  | 0.0075 | 7.6% | 93.5 | 94 | 98 | 20.7% | Frosted Glass |  | Feb/12/2023 | Link | |||
| Hooga | Red Sleep | Check Price → | Check Price → | 1000K | 1000K | 1000K | 40 | 1W | E26 | A15 | No | No Risk |  |  | 0.0503 | 18.5% | N/A | N/A | N/A | N/A | Frosted Plastic |  | Feb/11/2023 | Link | Use coupon code OPTIMIZE12 | |
| Philips | Ultra Definition | Check Price → | 5000K | 5000K | 5300K | 800 | 8W | E26 | A19 | Yes | No Risk |  |  | 0.0035 | 2.2% | 95.1 | 95 | 99 | 20.7% | Clear Glass |  | Feb/12/2023 | Link | |||
| Philips | Ultra Definition | Check Price → | 5000K | 5000K | 5200K | 500 | 5W | E26 | G25 | Yes | Low Risk |  |  | 0.0093 | 8% | 96.1 | 95 | 102 | 25.2% | Clear Glass |  | Feb/12/2023 | Link | |||
| GE | Sun Filled | Check Price → | 5000K | 5000K | 5350K | 680 | 8.5W | E26 | BR30 | Yes | High Risk |  |  | 0.0465 | 15.6% | 97.9 | 98 | 101 | 7.9% | Frosted Plastic |  | Feb/12/2023 | Link | |||
| Norb | Sleep CA | Check Price → | 2650K | 2650K | 2700K | 520 | 6W | E26 | A19 | Yes | High Risk |  |  | 0.0437 | 16.7% | 95.7 | 92 | 96 | 12.6% | Plastic |  | Feb/12/2023 | Link | |||
| Harth | Nite Nite | Check Price → | 1900K | 1900K | 1950K | N/A | 3W | E12 | C35 | Yes | No Risk |  |  | 0.1423 | 50.5% | 60.9 | 76 | 89 | 33.2% | Plastic |  | Feb/12/2023 | Link | |||
| Block Blue Light | Bio Light | Check Price → | Variable | 1800-4000K | Variable | 700 | 8W | E27 | A21 | No | No Risk |  |  | 0.0359 | 12% | 97.7 | 97 | 101 | 10.8% | Frosted Plastic |  | Feb/12/2023 | Link | Use coupon code OPTIMIZE10 | ||
| Hooga | Amber Sleep | Check Price → | Check Price → | 1700K | 1700K | 1700K | 600 | 7W | E26 | A19 | No | No Risk |  |  | 0.2392 | 88.9% | 59.2 | 72 | 86 | 39.9% | Plastic |  | Feb/12/2023 | Link | Use coupon code OPTIMIZE12 | |
| Kinur | Sleep | Check Price → | 1800K | 1800K | 1900K | 600 | 7W | E26 | A19 | No | High Risk |  |  | 0.2174 | 70.3% | 48.7 | 52 | 45 | 54.3% | Plastic |  | Feb/13/2023 | Link | |||
| restful. | Bedtime Bulb | Check Price → | 2200K | 2200K | 2350K | 450 | 6W | E26 | A19 | Yes | No Risk |  |  | 0.0031 | 1% | 95.3 | 95 | 101 | 17.8% | Frosted Glass |  | Feb/14/2023 | Link | |||
| Harth | Sleep Shift | Check Price → | 1600K | 1600K | 1600K | 600 | 7W | E26 | A19 | Yes | No Risk |  |  | 0.0074 | 2.5% | 57.5 | N/A | N/A | 49.1% | Plastic |  | Feb/14/2023 | Link | |||
| restful. | Bedtime Bulb | Check Price → | 2200K | 2200K | 2300K | 250 | 4W | E12 | B10 | Yes | No Risk |  |  | 0.0072 | 2.4% | 93.2 | 90 | 97 | 22% | Frosted Glass |  | Feb/14/2023 | Link | |||
| Harth | Nite Nite | Check Price → | 1600K | 1600K | 1650K | N/A | 3W | E26 | A15 | Yes | No Risk |  |  | 0.0126 | 4.5% | 57.5 | 73 | 80 | 39.7% | Plastic |  | Feb/14/2023 | Link | |||
| Hooga | Amber Sleep | Check Price → | Check Price → | 1700K | 1700K | 1650K | 80 | 1W | E26 | A15 | No | No Risk |  |  | 0.0442 | 15% | 58.9 | 74 | 80 | 39.9% | Plastic |  | Feb/13/2023 | Link | OPTIMIZE12 | |
| Kinur | Sleep | Check Price → | 1800K | 1800K | 1900K | 200 | 3W | E26 | A15 | No | No Risk |  |  | 0.0592 | 20.8% | 48.8 | 56 | 50 | 53.4% | Plastic |  | Feb/15/2023 | Link | |||
| Koze | Day | Check Price → | Check Price → | 5000K | 5000K | 5000K | 800 | 9W | E26 | A19 | Yes | High Risk |  |  | 32.7% | 0.1208 | 95.9 | 95 | 99 | 8.7% | Plastic |  | Feb/17/2023 | Link | 10% off through link | |
| TrueLight | Luna Red | Check Price → | Variable | 1000-3000K | Variable | Variable | 10.5W | E26 | BR30 | Yes | No Risk |  |  | 0.4288 | 99.5% | 93 | 91 | 98 | 20.9% | Plastic |  | Feb/17/2023 | Link | Use coupon code OPTIMIZE10OFF | ||
| Koze | Sleep | Check Price → | Check Price → | 1600K | 1600K | 1600K | 300 | 3.5W | E26 | A15 | No | No Risk |  |  | 0.0110 | 3.7% | 56.6 | 71 | 73 | 41.8% | Plastic |  | Feb/17/2023 | Link | 10% off through link | |
| Lighting Science | Sleepy Baby | Check Price → | 2100K | 2100K | 2050K | 275 | 4.5W | E26 | A15 | Yes | No Risk |  |  | 0.0026 | 0.9% | 77 | 84 | 86 | 29.7% | Plastic |  | Feb/17/2023 | Link | |||
| TrueLight | Luna Red | Check Price → | Variable | 1000-3000K | Variable | Variable | 7W | E26 | A19 | Yes | No Risk |  |  | 0.6750 | 99.5% | 86.7 | 91 | 99 | 21% | Plastic |  | Feb/18/2023 | Link | Use coupon code OPTIMIZE10OFF | ||
| Sylvania | Natural | Check Price → | 3500K | 3500K | 3550K | 1100 | 11W | E26 | A19 | Yes | Low Risk |  |  | 0.0060 | 4.5% | 89.5 | 91 | 95 | 15.8% | Frosted Glass |  | Feb/18/2023 | Link | |||
| Sylvania | Natural | Check Price → | 3500K | 3500K | 3400K | 1600 | 15W | E26 | A21 | Yes | Low Risk |  |  | 0.0084 | 5.8% | 90.2 | 92 | 96 | 13.6% | Frosted Glass |  | Feb/18/2023 | Link | |||
| Sylvania | Natural | Check Price → | 2700K | 2700K | 2750K | 800 | 8W | E26 | A19 | Yes | Low Risk |  |  | 0.0076 | 7% | 91.3 | 91 | 96 | 19.3% | Frosted Glass |  | Feb/18/2023 | Link | |||
| Sylvania | Natural | Check Price → | 2700K | 2700K | 2700K | 1100 | 11W | E26 | A19 | Yes | No Risk |  |  | 0.0057 | 4.1% | 90.4 | 89 | 96 | 23.5% | Frosted Glass |  | Feb/18/2023 | Link | |||
| Sylvania | Natural | Check Price → | 5000K | 5000K | 4900K | 1100 | 11W | E26 | A19 | Yes | No Risk |  |  | 0.0050 | 4.2% | 88.6 | 89 | 95 | 19.9% | Frosted Glass |  | Feb/18/2023 | Link | |||
| Sylvania | Natural | Check Price → | 2700K | 2700K | 2750K | 1600 | 15W | E26 | A21 | Yes | High Risk |  | | 0.0525 | 13.8% | 90.3 | 91 | 96 | 21% | Frosted Glass |  | Feb/18/2023 | Link | |||
| Sylvania | Natural | Check Price → | 5000K | 5000K | 5250K | 1600 | 15W | E26 | A21 | Yes | No Risk |  | 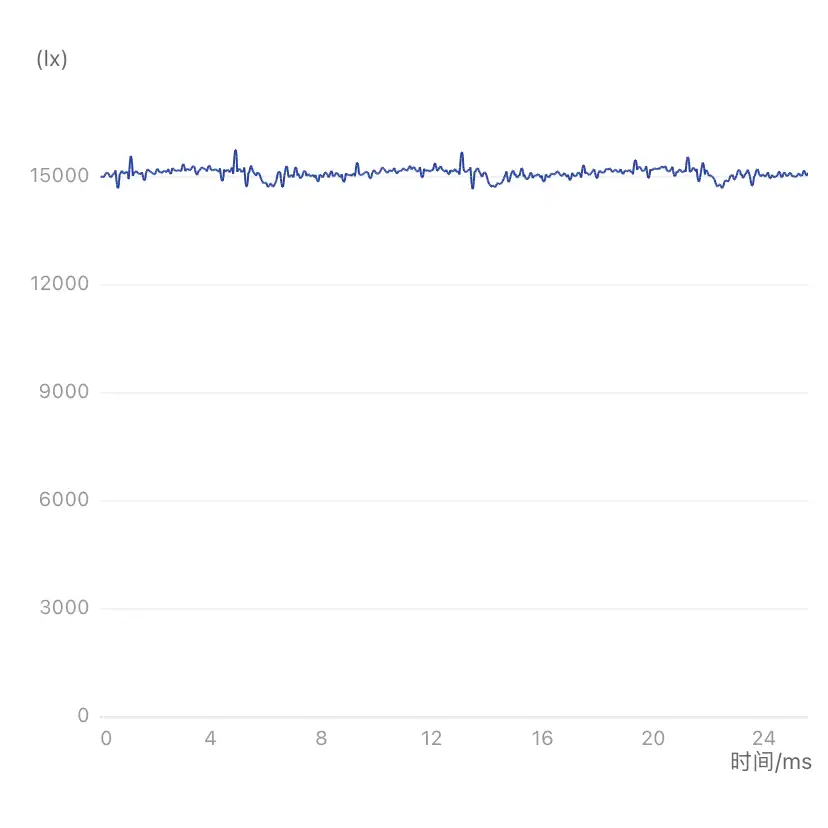 | 0.0047 | 3.5% | 87.3 | 91 | 95 | 14.6% | Frosted Glass |  | Feb/19/2023 | Link | |||
| Sylvania | Natural | Check Price → | 2700K | 2700K | 2800K | 650 | 7W | E26 | BR30 | Yes | High Risk |  |  | 0.0677 | 26% | 91.5 | 93 | 96 | 13.7% | Plastic |  | Feb/19/2023 | Link | |||
| Sylvania | Natural | Check Price → | 5000K | 5000K | 5500K | 650 | 7W | E26 | BR30 | Yes | High Risk |  |  | 0.0631 | 24.4% | 90.5 | 89 | 95 | 16.6% | Plastic |  | Feb/19/2023 | Link | |||
| Sylvania | Natural | Check Price → | 5000K | 5000K | 5350K | 1100 | 12W | E26 | BR40 | Yes | High Risk |  |  | 0.0511 | 19.8% | 89.3 | 87 | 93 | 18.6% | Plastic |  | Feb/19/2023 | Link | |||
| Sylvania | Natural | Check Price → | 2700K | 2700K | 2750K | 1100 | 12W | E26 | BR40 | Yes | High Risk | |  | 0.0498 | 18.9% | 91.1 | 93 | 98 | 14.9% | Plastic |  | Feb/19/2023 | Link | |||
| Low Blue Lights | Amber Night Light | Check Price → | 1600K | 1600K | 1500K | 30 | 0.5W | E12 | C7 | No | High Risk |  |  | 0.3814 | 99.5% | N/A | N/A | N/A | N/A | Plastic |  | Feb/24/2023 | Link | |||
| Low Blue Lights | Sleep Light Bulb | Check Price → | 2200K | 2200K | 2200K | 800 | 9W | E26 | A19 | Yes | High Risk |  |  | 0.1635 | 52.5% | 52.1 | 57 | 52 | 50.8% | Plastic |  | Feb/25/2023 | Link | |||
| Swanwick | Better Nights | Check Price → | 2200K | 2200K | 2150K | 260 | 4.4W | E26 | A19 | No | No Risk |  |  | 0.0013 | 0.2% | 28 | 28 | 25 | 65.5% | Plastic |  | Feb/27/2023 | Link | |||
| TCP | Red | Check Price → | 1000K | 1000K | 1000K | N/A | 5W | E26 | A15 | No | No Risk |  |  | 0.0040 | 1.7% | N/A | N/A | N/A | N/A | Plastic |  | Mar/01/2023 | Link | |||
| Sunlite | Red | Check Price → | 1000K | 1000K | 1000K | N/A | 3W | E26 | A19 | No | No Risk |  |  | 0.0049 | 4.1% | N/A | N/A | N/A | N/A | Plastic |  | Mar/01/2023 | Link | |||
| Kinur | Red | Check Price → | 1000K | 1000K | 1000K | 200 | 3W | E26 | A15 | No | No Risk |  |  | 0.0435% | 14.8% | N/A | N/A | N/A | N/A | Plastic |  | Mar/03/2023 | Link | |||
| Sunlite | Red Filament | Check Price → | 1000K | 1000K | 1000K | 33 | 4.5W | E26 | A19 | Yes | High Risk |  |  | 0.2317 | 72.9% | N/A | N/A | N/A | N/A | Red Glass |  | Mar/03/2023 | Link | |||
| Sunlite | Incandescent | Check Price → | 2850K | 2850K | 2350K | 30 | 7W | E12 | C7 | Yes | High Risk |  |  | 0.0406 | 13.4% | 98.2 | 98 | 98 | 3.2% | Frosted Glass |  | Feb/26/2023 | Link | |||
| Sunlite | Incandescent | Check Price → | 2600K | 2600K | 2650K | 320 | 40W | E26 | A15 | Yes | High Risk |  |  | 0.0326 | 10.2% | 97.1 | 98 | 99 | 2.5% | Clear Glass |  | Feb/26/2023 | Link | |||
| GE | Incandescent | Check Price → | 2850K | 2850K | 2950K | 3780 | 200W | E26 | A21 | Yes | No Risk |  |  | 0.0095 | 3.2% | 98 | 98 | 98 | 2.7% | Clear Glass |  | Feb/27/2023 | Link | |||
| GE | Incandescent | Check Price → | 2850K | 2850K | 2900K | 2710 | 150W | E26 | A21 | Yes | No Risk |  |  | 0.0107 | 3.8% | 98.3 | 98 | 99 | 1.9% | Clear Glass |  | Feb/27/2023 | Link | |||
| GE | Halogen | Check Price → | 2700K | 2700K | 2800K | 620 | 43W | E26 | A19 | Yes | Low Risk |  |  | 0.0236 | 7.4% | 98.7 | 99 | 100 | 2.4% | Frosted Glass |  | Mar/06/2023 | Link | |||
| GE | Halogen | Check Price → | 2800K | 2800K | 2900K | 390 | 29W | E26 | A19 | Yes | Low Risk |  |  | 0.0283 | 9.1% | 97.9 | 97 | 98 | 2.9% | Frosted Glass |  | Mar/07/2023 | Link | |||
| GE | Halogen | Check Price → | 2800K | 2800K | 2950K | 890 | 53W | E26 | A19 | Yes | Low Risk |  |  | 0.0208 | 6.7% | 98.8 | 99 | 99 | 1.2% | Frosted Glass |  | Mar/07/2023 | Link | |||
| GE | Halogen | Check Price → | 2850K | 2850K | 2900K | 1270 | 72W | E26 | A19 | Yes | Low Risk |  |  | 0.0207 | 7% | 99.3 | 99 | 100 | 1.4% | Frosted Glass |  | Mar/07/2023 | Link | |||
| Philips | Ultra Definition | Check Price → | 5000K | 5000K | 4950K | 1600 | 13.5W | E26 | A21 | Yes | High Risk |  |  | 0.1277 | 42.2% | 93.5 | 91 | 99 | 24.3% | Frosted Glass |  | Mar/17/2023 | Link | |||
| Soraa | Zeroblue | Check Price → | 2700K | 2700K | 2700K | 600 | 11W | E26 | A19 | Yes | Low Risk |  |  | 0.0060 | 4.3% | 78 | 62 | 110 | 48% | Plastic |  | May/05/2023 | Link | |||
| Soraa | Vivid | Check Price → | 3000K | 3000K | 3050K | 900 | 11W | E26 | A19 | Yes | Low Risk |  |  | 0.0192 | 9.7% | 95.5 | 95 | 101 | 12.8% | Frosted |  | May/05/2023 | Link | |||
| Yuji | WELL24 Nite | Check Price → | 2200K | 2200K | 2200K | 1000 | 11W | E26 | A19 | Yes | No Risk |  |  | 0.0021 | 0.7% | 81.6 | 80 | 107 | 36.4% | Plastic |  | Jun/17/2023 | Link | OYBYJ5 for 5% off | ||
| Yuji | WELL24 Day | Check Price → | 4000K | 4000K | 4100K | 1100 | 11W | E26 | A19 | Yes | No Risk |  |  | 0.0022 | 0.7% | 83.9 | 80 | 91 | 18.5% | Plastic |  | Jun/17/2023 | Link | OYBYJ5 for 5% off | ||
| Yuji | CRI-MAX | Check Price → | 5000K | 5000K | 5100K | 1100 | 11W | E26 | A19 | Yes | No Risk |  |  | 0.0030 | 1% | 93.7 | 88 | 96 | 18.1% | Plastic |  | Jun/17/2023 | Link | OYBYJ5 for 5% off | ||
| Yuji | CRI-MAX | Check Price → | 5600K | 5600K | 5750K | 1100 | 11W | E26 | A19 | Yes | No Risk |  |  | 0.0028 | 1% | 92.5 | 87 | 95 | 18.4% | Plastic |  | Jun/17/2023 | Link | OYBYJ5 for 5% off | ||
| Yuji | SunWave | Check Price → | 3000K | 3000K | 3050K | 1100 | 11W | E26 | A19 | Yes | No Risk |  |  | 0.0030 | 1.2% | 97.7 | 96 | 101 | 11.9% | Plastic |  | Jun/17/2023 | Link | OYBYJ5 for 5% off | ||
| Yuji | SunWave | Check Price → | 4000K | 4000K | 4100K | 1100 | 11W | E26 | A19 | Yes | No Risk |  |  | 0.0027 | 1% | 96.9 | 93 | 98 | 9.5% | Plastic |  | Jun/17/2023 | Link | OYBYJ5 for 5% off | ||
| Yuji | SunWave | Check Price → | 6500K | 6500K | 6600K | 1100 | 11W | E26 | A19 | Yes | No Risk |  |  | 0.0028 | 1% | 95.3 | 92 | 97 | 8.7% | Plastic |  | Jun/17/2023 | Link | OYBYJ5 for 5% off | ||
| Yuji | NormLite | Check Price → | 5000K | 5000K | 5250K | 1100 | 11W | E26 | A19 | Yes | No Risk |  |  | 0.0023 | 1% | 96.9 | 94 | 98 | 8.3% | Plastic |  | Feb/08/2024 | Link | OYBYJ5 for 5% off | ||
| Sunsy | Shine | Check Price → | Check Price → | 2700K | 2700K | 670 | 11W | E26 | A19 | Yes | No Risk |  | 0.0014 | 0.5% | 97 | 94 | 103 | 15.6% | Plastic |  | Feb/12/2025 | |||||
| Sunsy | Shine | Check Price → | Check Price → | 4000K | 4000K | 820 | 11W | E26 | A19 | Yes | No Risk | | 0.0015 | 0.5% | 97 | 96 | 102 | 11.3% | Plastic |  | Feb/12/2025 | |||||
| Sunsy | Shine | Check Price → | Check Price → | 5700K | 5700K | 845 | 11W | E26 | A19 | Yes | No Risk | | 0.0014 | 0.5% | 97 | 97 | 102 | 10.3% | Plastic |  | Feb/12/2025 |


Hi Derek, great job on everything you do here. My question is, why are most of the bulbs tested and most of the articles on LEDs? Aren’t traditional incandescents (when you can get them) one of the best options, particularly with respect to the Red and NIR they emit? I’m kind of new to all this, but definitely on board with the need for healthy lighting, and trying to learn as much as I can.
Hey Ron! So the thing with incandescent/halogen is they’re basically all the same, so while I’ve tested a few there’s really nothing different between brands aside form possible build quality, but I don’t have much of a way to test that.
Beyond that you’re correct, their red and infrared output are wonderful and that’s why I recommend using them alongside nice full spectrum LEDs. Two downsides to tungsten filament based lighting is the lack of blue/green light for daytime, and their flicker. While LEDs can be flicker free if made well, TF always flicker unless DC powered.
I would like to test more bulbs, something we’ve been meaning to get to but may be getting new equipment for that.
Got it. Thanks. I guess I my perception of LEDs has been that they’re all blue light, but clearly full spectrum LEDs have much more to offer. Thanks for all you’re doing!
Yes the industry is changing! Though most LEDs are still pretty bad.
Hi! Do you have plans to test the non-smart IKEA bulbs? From a quick look through my phone camera at a higher shutter speed, they appear to not have much/any flicker. They have some decorative bulbs which are quite warm and nice for floor lamps/table lamps in the evening. In my household we enjoy the Lunnom (have the e12 200 lumen, e26 globe 450 lumen, and teardrop e26 150 lumen variants) and Molnart (e26 140 lumen) which are all 1800-2200K. Would be interesting to see how they stack up in the testing! Especially since we just discovered that the IKEA floor lamps and table lamps etc now have very low wattage ratings, so there’s no option to put in a decorative incandescent (while keeping the same lamps). Thanks again for all your work here, this site is a great resource!
hi Liz! We definitely want to. However it’s just not something we have time for right now. I think if they pass the 240 Hz slow motion test that’s at least a good sign.
Hi,
Would you be open to adding Melanopic D65 Efficacy Ratio (mDER) to your table? It describes how much impact the bulb will have on melanopsin receptors compared to sunlight, which can help people find light bulbs that are appropriate for circadian health at different times of day. There are other measures like Circadian Light that try to do the same thing, but the melanopic measurements are simpler and have equal predictive power.
You can calculate mDER using the spectral power distribution that you already have in the table, along with the illuminance (lux) reading associated with the spd measurement. First, find the Melanopic Equivalent Daylight Illuminance using a tool like https://luox.app, and then divide by the illuminance.
Hey Greg! Great idea, I see you know your stuff. The plan right now is to eventually upgrade our equipment and revamp this whole thing with better charts, graphs, and data. And that is certainly a metric that will be included.
Hello, I’d love to see the light bulbs from healthy home shop in Canada tested, if/when you’re able, as that’s what I’ve already purchased based on a recommendation. Thanks!
Hey Steph! Definitely hoping to get to these eventually!
I’m unable to print the results of a search, nor save a search, so I took screenshots.
It would be great to be able to print all the details on the screen or to save a search.
Wonderful database
I’ll try to see if I can add that Jeff!
Hi, love the information. In terms of box stores: due to tariffs, GE and Philips are no longer sold at Lowe’s/depot. Will you be posting studies on the new “made in USA” brands for those bulbs?